- Resource Library
- Math
- Data And Graphing
- Histogram Interpretation
- Interpreting Histograms: Key Concepts And Techniques
Interpreting Histograms: Key Concepts and Techniques
Interactive Video
•
Mathematics
•
6th - 10th Grade
•
Practice Problem
•
Hard
+3
Standards-aligned

Sophia Harris
FREE Resource
Standards-aligned
Read more
10 questions
Show all answers
1.
MULTIPLE CHOICE QUESTION
30 sec • 1 pt
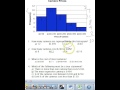
What does the x-axis of the histogram represent?
Camera models
Camera brands
Number of cameras sold
Price ranges of cameras
Tags
CCSS.6.SP.B.4
CCSS.HSS.ID.A.1
2.
MULTIPLE CHOICE QUESTION
30 sec • 1 pt
How is the frequency on the histogram determined?
By the color of the bars
By the width of the bars
By the height of the bars
By the label on the x-axis
Tags
CCSS.6.SP.B.4
CCSS.HSS.ID.A.1
3.
MULTIPLE CHOICE QUESTION
30 sec • 1 pt
What is the total number of cameras represented in the histogram?
22 cameras
15 cameras
25 cameras
32 cameras
Tags
CCSS.6.SP.B.5A
4.
MULTIPLE CHOICE QUESTION
30 sec • 1 pt
How many cameras cost between $0 and $99?
11 cameras
7 cameras
2 cameras
8 cameras
Tags
CCSS.6.SP.B.4
CCSS.HSS.ID.A.1
5.
MULTIPLE CHOICE QUESTION
30 sec • 1 pt
How many cameras cost $200 or more according to the histogram?
14 cameras
12 cameras
4 cameras
8 cameras
Tags
CCSS.6.SP.B.4
CCSS.HSS.ID.A.1
6.
MULTIPLE CHOICE QUESTION
30 sec • 1 pt
In which price range do most cameras fall?
$400 - $499
$0 - $99
$200 - $299
$100 - $199
Tags
CCSS.6.SP.B.4
CCSS.HSS.ID.A.1
7.
MULTIPLE CHOICE QUESTION
30 sec • 1 pt
Is it true that there is more than one camera that costs exactly $100?
No, all cameras cost more than $100
Yes, definitely
No, it's not certain
Yes, but only in one category
Tags
CCSS.3.MD.B.3
Access all questions and much more by creating a free account
Create resources
Host any resource
Get auto-graded reports
Continue with Google

Continue with Email
Continue with Microsoft
or continue with

%20(1).png)
Apple
Others
Already have an account?
