- Resource Library
- Math
- Percents, Ratios, And Rates
- Proportional Relationships
- Proportional Vs Non Proportional Relationships
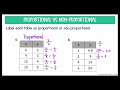
Proportional vs Non Proportional Relationships
Interactive Video
•
Mathematics
•
6th - 10th Grade
•
Practice Problem
•
Medium
+1
Standards-aligned

Lucas Foster
Used 98+ times
FREE Resource
Standards-aligned
Read more
10 questions
Show all answers
1.
MULTIPLE CHOICE QUESTION
30 sec • 1 pt
What defines a proportional relationship between two variables?
The product of the variables must increase linearly.
The difference between the variables must remain constant.
The variables must add up to the same total.
The ratio between the variables must always be equal.
Tags
CCSS.7.RP.A.2A
2.
MULTIPLE CHOICE QUESTION
30 sec • 1 pt
How can you determine if a table represents a proportional relationship?
By verifying the table has at least three rows.
By confirming the table contains only whole numbers.
By checking if the ratio of y over x is constant across the table.
By ensuring each row adds up to the same total.
Tags
CCSS.7.RP.A.2A
3.
MULTIPLE CHOICE QUESTION
30 sec • 1 pt
What is a key feature of a proportional table?
The ratio of corresponding x and y values must be constant.
It should contain equal numbers of x and y values.
It must start with the value zero.
Each row must sum to the same total.
Tags
CCSS.7.RP.A.2C
4.
MULTIPLE CHOICE QUESTION
30 sec • 1 pt
What indicates a non-proportional relationship in a table?
If the ratio of y over x varies between rows.
If the table has more than two columns.
If the sum of each row is different.
If the table includes negative numbers.
Tags
CCSS.7.RP.A.2A
5.
MULTIPLE CHOICE QUESTION
30 sec • 1 pt
If a table's y over x ratio changes in different rows, how is the relationship classified?
Non-proportional
Proportional
Linear
Undefined
Tags
CCSS.7.RP.A.2A
6.
MULTIPLE CHOICE QUESTION
30 sec • 1 pt
Which characteristics must a graph have to represent a proportional relationship?
The graph must contain only positive values.
The graph must be a curve that passes through the origin.
The graph must be linear and include the point (0,0).
The graph must intersect the y-axis above the origin.
Tags
CCSS.7.RP.A.2D
7.
MULTIPLE CHOICE QUESTION
30 sec • 1 pt
Why is a graph that curves not considered proportional?
Because it intersects the y-axis multiple times.
Because it is not a straight line.
Because it only contains positive values.
Because it does not pass through the origin.
Tags
CCSS.7.RP.A.2D
Access all questions and much more by creating a free account
Create resources
Host any resource
Get auto-graded reports
Continue with Google

Continue with Email
Continue with Microsoft
or continue with

%20(1).png)
Apple
Others
Already have an account?
