- Resource Library
- Math
- Data And Graphing
- ...
- Exploring Measures Of Central Tendency With Jchs Football Scores
Exploring Measures of Central Tendency with JCHS Football Scores
Interactive Video
•
Mathematics
•
1st - 5th Grade
•
Practice Problem
•
Hard
+1
Standards-aligned

Mia Campbell
FREE Resource
Standards-aligned
Read more
10 questions
Show all answers
1.
MULTIPLE CHOICE QUESTION
30 sec • 1 pt
What does 'mean' refer to in statistics?
The middle value in a data set
The difference between the highest and lowest values
The most frequently occurring value
The average value of a data set
Tags
CCSS.6.SP.B.5C
2.
MULTIPLE CHOICE QUESTION
30 sec • 1 pt
How is the median value determined in a data set?
By identifying the most frequent value
By calculating the average of all values
By subtracting the smallest value from the largest
By finding the middle value after arranging the data in order
Tags
CCSS.6.SP.B.5C
3.
MULTIPLE CHOICE QUESTION
30 sec • 1 pt
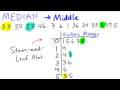
What is a stem-and-leaf plot used for?
To identify the mode of the data
To determine the mean of the data
To organize data in order to easily find the median
To calculate the range of a data set
4.
MULTIPLE CHOICE QUESTION
30 sec • 1 pt
What does it mean if a data set has no mode?
All values occur with the same frequency
No values repeat in the data set
The data set cannot be analyzed
The mean is also the median
Tags
CCSS.6.SP.A.3
5.
MULTIPLE CHOICE QUESTION
30 sec • 1 pt
How is the range of a data set calculated?
Average of the highest and lowest values
Highest value minus the lowest value
Highest value divided by the lowest value
Highest value plus the lowest value
Tags
CCSS.6.SP.B.4
CCSS.HSS.ID.A.1
6.
MULTIPLE CHOICE QUESTION
30 sec • 1 pt
What is the difference in medians of the high-rise buildings between City 1 and City 2?
2
5
3
4
7.
MULTIPLE CHOICE QUESTION
30 sec • 1 pt
If City 1 has a median building height of 40 stories, what is the median height for City 2?
38 stories
42 stories
35 stories
40 stories
Access all questions and much more by creating a free account
Create resources
Host any resource
Get auto-graded reports
Continue with Google

Continue with Email
Continue with Microsoft
or continue with

%20(1).png)
Apple
Others
Already have an account?
