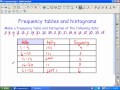
Exploring Frequency Tables and Histograms
Interactive Video
•
Mathematics
•
6th - 8th Grade
•
Practice Problem
•
Hard
Standards-aligned

Sophia Harris
FREE Resource
Standards-aligned
Read more
10 questions
Show all answers
1.
MULTIPLE CHOICE QUESTION
30 sec • 1 pt
What is the primary purpose of a frequency table?
To write extensive reports
To calculate complex equations
To collect and organize data
To draw detailed diagrams
Tags
CCSS.1.MD.C.4
2.
MULTIPLE CHOICE QUESTION
30 sec • 1 pt
What must be consistent about the intervals in a frequency table?
They must be based on data type
They must overlap each other
They must be of the same size
They must vary in size
Tags
CCSS.6.SP.B.4
CCSS.HSS.ID.A.1
3.
MULTIPLE CHOICE QUESTION
30 sec • 1 pt
How are tally marks used in a frequency table?
To label the table columns
To draw the table borders
To calculate the total data points
To represent individual data points
Tags
CCSS.1.MD.C.4
4.
MULTIPLE CHOICE QUESTION
30 sec • 1 pt
Why is it important to cross off data points when using tally marks?
To create more intervals
To ensure data points are not counted more than once
To make the table look cleaner
To confuse the data collection process
Tags
CCSS.1.MD.C.4
5.
MULTIPLE CHOICE QUESTION
30 sec • 1 pt
What should be done when tally marks reach five in a frequency table?
Start a new table
Cross the fifth mark
Erase all previous marks
Ignore the fifth mark
Tags
CCSS.1.MD.C.4
6.
MULTIPLE CHOICE QUESTION
30 sec • 1 pt
What does the bottom axis of a histogram represent?
Percentage scores
Categories
Frequency values
Data intervals
Tags
CCSS.6.SP.B.4
CCSS.HSS.ID.A.1
7.
MULTIPLE CHOICE QUESTION
30 sec • 1 pt
Why are histograms used instead of bar graphs for frequency tables?
To avoid labeling the axes
To represent continuous intervals
To show non-continuous data
To use different colors
Tags
CCSS.6.SP.B.4
CCSS.HSS.ID.A.1
Access all questions and much more by creating a free account
Create resources
Host any resource
Get auto-graded reports
Continue with Google

Continue with Email
Continue with Classlink
Continue with Clever
or continue with
Microsoft
%20(1).png)
Apple
Others
Already have an account?
Similar Resources on Wayground
Popular Resources on Wayground

15 questions
Fractions on a Number Line
Quiz
•
3rd Grade
10 questions
Probability Practice
Quiz
•
4th Grade
15 questions
Probability on Number LIne
Quiz
•
4th Grade
20 questions
Equivalent Fractions
Quiz
•
3rd Grade
25 questions
Multiplication Facts
Quiz
•
5th Grade
22 questions
fractions
Quiz
•
3rd Grade
6 questions
Appropriate Chromebook Usage
Lesson
•
7th Grade
10 questions
Greek Bases tele and phon
Quiz
•
6th - 8th Grade
Discover more resources for Mathematics
20 questions
Writing Algebraic Expressions
Quiz
•
6th Grade
20 questions
Ratios/Rates and Unit Rates
Quiz
•
6th Grade
14 questions
Volume of rectangular prisms
Quiz
•
7th Grade
15 questions
Graphing Inequalities
Quiz
•
7th - 9th Grade
20 questions
Graphing Inequalities on a Number Line
Quiz
•
6th - 9th Grade
20 questions
One Step Equations
Quiz
•
6th Grade
12 questions
One-Step Equations
Quiz
•
6th Grade
6 questions
Equations from models
Quiz
•
6th Grade