Exploring Scatterplots and Correlations
Interactive Video
•
Mathematics
•
6th - 8th Grade
•
Practice Problem
•
Hard
Standards-aligned

Sophia Harris
FREE Resource
Standards-aligned
Read more
10 questions
Show all answers
1.
MULTIPLE CHOICE QUESTION
30 sec • 1 pt
What is the primary purpose of a scatter plot?
To show relationships between two sets of data
To display data in a hierarchical structure
To predict future trends
To calculate statistical averages
Tags
CCSS.8.SP.A.1
2.
MULTIPLE CHOICE QUESTION
30 sec • 1 pt
What does a positive correlation in a scatter plot indicate?
As one variable increases, the other decreases
As one variable increases, the other also increases
No relationship between the variables
As one variable decreases, the other decreases
Tags
CCSS.HSS.ID.B.5
3.
MULTIPLE CHOICE QUESTION
30 sec • 1 pt
How can you identify a positive correlation in a scatter plot?
The points are randomly distributed
All points are at the same level
The points form a downward trend
The points form an upward trend
Tags
CCSS.HSF-LE.A.1B
4.
MULTIPLE CHOICE QUESTION
30 sec • 1 pt
Which type of correlation is shown when one variable increases and the other decreases?
Cannot be determined from a scatter plot
Positive correlation
Negative correlation
No correlation
Tags
CCSS.HSS.ID.B.5
5.
MULTIPLE CHOICE QUESTION
30 sec • 1 pt
What does it mean if a scatter plot shows no correlation?
The variables are not related to each other
The variables move in opposite directions
The variables move in the same direction
There is no discernible pattern between the variables
Tags
CCSS.HSS.ID.B.5
6.
MULTIPLE CHOICE QUESTION
30 sec • 1 pt
What is an outlier in the context of scatter plots?
A data point that aligns well with others
A data point that stands far from other data points
A graphical representation of the mean
A cluster of very similar data points
Tags
CCSS.8.SP.A.1
7.
MULTIPLE CHOICE QUESTION
30 sec • 1 pt
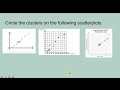
What is a cluster in a scatter plot?
A representation of the median value
A group of closely located data points
A group of data points that are far apart
A single, isolated data point
Tags
CCSS.8.SP.A.1
Access all questions and much more by creating a free account
Create resources
Host any resource
Get auto-graded reports
Continue with Google

Continue with Email
Continue with Classlink
Continue with Clever
or continue with
Microsoft
%20(1).png)
Apple
Others
Already have an account?
Popular Resources on Wayground

15 questions
Fractions on a Number Line
Quiz
•
3rd Grade
20 questions
Equivalent Fractions
Quiz
•
3rd Grade
25 questions
Multiplication Facts
Quiz
•
5th Grade
54 questions
Analyzing Line Graphs & Tables
Quiz
•
4th Grade
22 questions
fractions
Quiz
•
3rd Grade
20 questions
Main Idea and Details
Quiz
•
5th Grade
20 questions
Context Clues
Quiz
•
6th Grade
15 questions
Equivalent Fractions
Quiz
•
4th Grade
Discover more resources for Mathematics
22 questions
distributive property
Quiz
•
7th Grade
18 questions
Angle Relationships
Quiz
•
7th Grade
15 questions
Distributive Property & Review
Quiz
•
6th Grade
20 questions
Writing Algebraic Expressions
Quiz
•
6th Grade
20 questions
How Some Friendships Last — and Others Don’t Video Questions
Quiz
•
7th Grade
14 questions
finding slope from a graph
Quiz
•
8th Grade
20 questions
Ratios/Rates and Unit Rates
Quiz
•
6th Grade
18 questions
Handbook Refresher Quiz
Quiz
•
7th Grade