- Resource Library
- Math
- Probability And Statistics
- Mean Absolute Deviation
- Exploring Mean Absolute Deviation Concepts
Exploring Mean Absolute Deviation Concepts
Interactive Video
•
Mathematics
•
6th - 8th Grade
•
Practice Problem
•
Hard
Standards-aligned

Jackson Turner
FREE Resource
Standards-aligned
Read more
10 questions
Show all answers
1.
MULTIPLE CHOICE QUESTION
30 sec • 1 pt
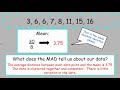
What does MAD stand for in statistics?
Mode Absolute Difference
Mean Aligned Deviation
Median Aligned Data
Mean Absolute Deviation
Tags
CCSS.6.SP.B.5C
2.
MULTIPLE CHOICE QUESTION
30 sec • 1 pt
What tool is recommended to use when calculating the mean in the lesson?
A ruler
A calculator
None of the above
A protractor
Tags
CCSS.6.SP.B.5C
3.
MULTIPLE CHOICE QUESTION
30 sec • 1 pt
What is the first step in calculating the mean absolute deviation?
Calculate the mean of the data
None of the above
Subtract the mean from each data point
Calculate the absolute values of differences
Tags
CCSS.6.SP.B.5C
4.
MULTIPLE CHOICE QUESTION
30 sec • 1 pt
How do you find the mean of a set of numbers?
None of the above
Add all numbers and divide by the total count
Subtract each number by the smallest value
Multiply all numbers and take the square root
Tags
CCSS.6.SP.B.5C
5.
MULTIPLE CHOICE QUESTION
30 sec • 1 pt
Which of the following is NOT a step in calculating MAD?
Finding the mean of the data
Calculating the square of each deviation
Averaging the absolute deviations
Calculating the absolute value of each deviation
Tags
CCSS.6.SP.B.5C
6.
MULTIPLE CHOICE QUESTION
30 sec • 1 pt
What does a high MAD indicate about a dataset?
All data points are identical
There is no variability in the data
Data points are closely clustered around the mean
Data points are spread out over a large range of values
Tags
CCSS.6.SP.B.5C
7.
MULTIPLE CHOICE QUESTION
30 sec • 1 pt
What does a low MAD value suggest about the data?
Data points are outliers
High variability
Low consistency
Data points are close to the mean
Tags
CCSS.6.SP.B.5C
Access all questions and much more by creating a free account
Create resources
Host any resource
Get auto-graded reports
Continue with Google

Continue with Email
Continue with Classlink
Continue with Clever
or continue with
Microsoft
%20(1).png)
Apple
Others
Already have an account?
