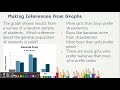
Making Inferences from Graphs
Interactive Video
•
English
•
6th - 8th Grade
•
Practice Problem
•
Medium
+11
Standards-aligned

Olivia Brooks
Used 5+ times
FREE Resource
Standards-aligned
Read more
10 questions
Show all answers
1.
MULTIPLE CHOICE QUESTION
30 sec • 1 pt
What is the first step in making an inference from data?
Use the graph or table
Find the smallest number
Read all the answers and choices
Identify the keywords
Tags
CCSS.RI.6.7
CCSS.RI.7.7
CCSS.RI.8.7
CCSS.RL.7.7
CCSS.RL.8.7
2.
MULTIPLE CHOICE QUESTION
30 sec • 1 pt
What does 'valid' inference mean in the context of the video?
An incorrect inference
A guess without data support
An inference supported by data
An inference supported by opinions
Tags
CCSS.RI.6.1
CCSS.RI.8.1
CCSS.RL.6.1
CCSS.RL.7.1
CCSS.RL.8.1
3.
MULTIPLE CHOICE QUESTION
30 sec • 1 pt
Based on the survey, what is the most likely summer plan for a student at Baker School?
Traveling
Staying at home
Visiting relatives
Attending summer school
Tags
CCSS.RI.6.7
CCSS.RI.7.7
CCSS.RI.8.7
CCSS.RL.6.7
CCSS.RL.7.7
4.
MULTIPLE CHOICE QUESTION
30 sec • 1 pt
How can you determine the most popular summer plan from the survey data?
By guessing the most popular choice
By finding the largest number
By asking more students
By finding the smallest number
Tags
CCSS.2.MD.D.10
5.
MULTIPLE CHOICE QUESTION
30 sec • 1 pt
Which grade is most likely to attend the school dance, according to the survey?
All grades equally
Eighth graders
Seventh graders
Sixth graders
Tags
CCSS.RI.6.7
CCSS.RI.7.7
CCSS.RI.8.7
CCSS.RL.7.7
CCSS.RL.8.7
6.
MULTIPLE CHOICE QUESTION
30 sec • 1 pt
What incorrect assumption is made about eighth graders in the school dance data?
They like dancing more than seventh graders
They are fewer than sixth graders
They do not like to dance
They are the majority at the dance
Tags
CCSS.3.MD.B.3
7.
MULTIPLE CHOICE QUESTION
30 sec • 1 pt
Which statement about fruit preferences is supported by the survey data?
More girls than boys prefer strawberries
Boys prefer bananas over strawberries
More girls prefer bananas than boys prefer pears
More boys than girls prefer pears
Tags
CCSS.8.SP.A.4
Access all questions and much more by creating a free account
Create resources
Host any resource
Get auto-graded reports
Continue with Google

Continue with Email
Continue with Classlink
Continue with Clever
or continue with
Microsoft
%20(1).png)
Apple
Others
Already have an account?
Popular Resources on Wayground

15 questions
Fractions on a Number Line
Quiz
•
3rd Grade
20 questions
Equivalent Fractions
Quiz
•
3rd Grade
25 questions
Multiplication Facts
Quiz
•
5th Grade
29 questions
Alg. 1 Section 5.1 Coordinate Plane
Quiz
•
9th Grade
22 questions
fractions
Quiz
•
3rd Grade
11 questions
FOREST Effective communication
Lesson
•
KG
20 questions
Main Idea and Details
Quiz
•
5th Grade
20 questions
Context Clues
Quiz
•
6th Grade
Discover more resources for English
20 questions
Context Clues
Quiz
•
6th Grade
20 questions
Figurative Language Review
Quiz
•
6th Grade
20 questions
7th grade ELA Vocabulary Review
Quiz
•
7th - 8th Grade
30 questions
Literary Terms and Definitions Quiz
Quiz
•
6th Grade
7 questions
Path and Ortho Greek bases
Quiz
•
6th - 8th Grade
24 questions
7th grade STAAR Reading Review
Quiz
•
7th Grade
20 questions
Relative Pronouns
Quiz
•
4th - 8th Grade
12 questions
Final Figurative Language Review
Lesson
•
6th - 8th Grade