Exploring Stem and Leaf Plots and Measures of Central Tendency
Interactive Video
•
Mathematics
•
6th - 8th Grade
•
Practice Problem
•
Hard
Standards-aligned

Olivia Brooks
FREE Resource
Standards-aligned
Read more
10 questions
Show all answers
1.
MULTIPLE CHOICE QUESTION
30 sec • 1 pt
What is the primary purpose of a stem-and-leaf plot?
To calculate complex equations
To display numerical data effectively
To write extensive reports
To create graphical artwork
2.
MULTIPLE CHOICE QUESTION
30 sec • 1 pt
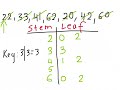
In a stem-and-leaf plot, where do you place the smallest value?
In the stem on the left
Outside the plot
In the leaf on the right
In the middle of the plot
3.
MULTIPLE CHOICE QUESTION
30 sec • 1 pt
What must be included at the top of a stem-and-leaf plot?
The smallest value
A random number
The largest value
The title of the plot
4.
MULTIPLE CHOICE QUESTION
30 sec • 1 pt
What does the key in a stem-and-leaf plot help with?
Determining the plot's title
Calculating the mean
Understanding how to read the values
Organizing the leaves
5.
MULTIPLE CHOICE QUESTION
30 sec • 1 pt
What is crucial to include in a stem-and-leaf plot to understand the values?
A key
A ruler
A pencil
A calculator
6.
MULTIPLE CHOICE QUESTION
30 sec • 1 pt
Why is it important to include all numbers in a stem-and-leaf plot?
To practice counting
To use more ink
To make the plot look fuller
To ensure accurate representation of data
7.
MULTIPLE CHOICE QUESTION
30 sec • 1 pt
What statistical measure is described as the most frequently occurring number in a dataset?
Mode
Median
Range
Mean
Tags
CCSS.6.SP.B.5D
CCSS.HSS.ID.A.2
Access all questions and much more by creating a free account
Create resources
Host any resource
Get auto-graded reports
Continue with Google

Continue with Email
Continue with Microsoft
or continue with

%20(1).png)
Apple
Others
Already have an account?
