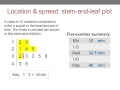
Analyzing Stem and Leaf Plots for Statistical Insights
Interactive Video
•
Mathematics
•
6th - 8th Grade
•
Practice Problem
•
Hard
+1
Standards-aligned

Ethan Morris
FREE Resource
Standards-aligned
10 questions
Show all answers
1.
MULTIPLE CHOICE QUESTION
30 sec • 1 pt
What is the primary benefit of using a stem-and-leaf plot in data analysis?
It reduces the size of the data set.
It visually represents data distribution clearly.
It simplifies complex data.
It automatically calculates data averages.
2.
MULTIPLE CHOICE QUESTION
30 sec • 1 pt
What does the five-number summary consist of?
Mean, median, mode, range, and standard deviation
First quartile, third quartile, median, mode, and mean
Minimum, maximum, median, first and third quartiles
Minimum, median, mode, range, and maximum
Tags
CCSS.6.SP.B.5B
3.
MULTIPLE CHOICE QUESTION
30 sec • 1 pt
How is the lower quartile determined in a data set?
It's the median of the upper half of the data.
It's the average of all data points.
It's the highest value in the data set.
It's the median of the lower half of the data.
Tags
CCSS.6.SP.B.5C
4.
MULTIPLE CHOICE QUESTION
30 sec • 1 pt
Which of the following is not part of the five-number summary?
The mean of the data
The maximum value
The median
The minimum value
Tags
CCSS.6.SP.B.5B
5.
MULTIPLE CHOICE QUESTION
30 sec • 1 pt
What is the correct way to read values from a stem-and-leaf plot?
Read the leaf numbers as individual values.
Combine the leaf numbers with the stem directly.
Subtract the stem from the leaf numbers.
Multiply the stem by the leaf numbers.
6.
MULTIPLE CHOICE QUESTION
30 sec • 1 pt
How do you find the median in a stem-and-leaf plot with an even number of scores?
It's the highest value in the plot.
It's the average of the two middlemost numbers.
It's the sum of all numbers divided by their count.
It's the value at the exact middle of the plot.
7.
MULTIPLE CHOICE QUESTION
30 sec • 1 pt
What is the lower quartile if the lower half of the data has six scores?
It's the value between the third and fourth scores.
It's the lowest value of the six scores.
It's the highest value of the six scores.
It's the average of all six scores.
Tags
CCSS.6.SP.B.5C
Access all questions and much more by creating a free account
Create resources
Host any resource
Get auto-graded reports
Continue with Google

Continue with Email
Continue with Classlink
Continue with Clever
or continue with
Microsoft
%20(1).png)
Apple
Others
Already have an account?
Popular Resources on Wayground

8 questions
Spartan Way - Classroom Responsible
Quiz
•
9th - 12th Grade
15 questions
Fractions on a Number Line
Quiz
•
3rd Grade
14 questions
Boundaries & Healthy Relationships
Lesson
•
6th - 8th Grade
20 questions
Equivalent Fractions
Quiz
•
3rd Grade
3 questions
Integrity and Your Health
Lesson
•
6th - 8th Grade
25 questions
Multiplication Facts
Quiz
•
5th Grade
9 questions
FOREST Perception
Lesson
•
KG
20 questions
Main Idea and Details
Quiz
•
5th Grade
Discover more resources for Mathematics
12 questions
Review: Surface Area of Rectangular and Triangular Prisms
Quiz
•
6th Grade
20 questions
Scatter Plots and Line of Best Fit
Quiz
•
8th Grade
36 questions
6th Grade Math STAAR Review
Quiz
•
6th Grade
12 questions
8th U6 L4 - Fitting a Line to Data
Quiz
•
8th Grade
14 questions
Volume of rectangular prisms
Quiz
•
7th Grade
25 questions
Scatter Plots and Line of Best Fit
Quiz
•
8th Grade
14 questions
finding slope from a graph
Quiz
•
8th Grade
20 questions
Graphing Inequalities on a Number Line
Quiz
•
6th - 9th Grade