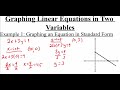
Graphing Linear Equations in Two Variables
Interactive Video
•
Mathematics
•
9th - 12th Grade
•
Practice Problem
•
Hard
+1
Standards-aligned

Ethan Morris
FREE Resource
Standards-aligned
10 questions
Show all answers
1.
MULTIPLE CHOICE QUESTION
30 sec • 1 pt
What type of graph do linear equations always produce?
Circle
Curved line
Parabola
Straight line
2.
MULTIPLE CHOICE QUESTION
30 sec • 1 pt
How many points are needed to graph a linear equation?
Four
Three
Two
One
3.
MULTIPLE CHOICE QUESTION
30 sec • 1 pt
What is the x-intercept of the equation 2x + 3y = 9?
(0, 3)
(4.5, 0)
(0, 4.5)
(3, 0)
4.
MULTIPLE CHOICE QUESTION
30 sec • 1 pt
What is the y-intercept of the equation 2x + 3y = 9?
(0, 4.5)
(4.5, 0)
(3, 0)
(0, 3)
Tags
CCSS.8.EE.B.6
CCSS.8.F.A.3
5.
MULTIPLE CHOICE QUESTION
30 sec • 1 pt
In the slope-intercept form y = mx + b, what does 'm' represent?
Coefficient of y
x-intercept
y-intercept
Slope
Tags
CCSS.8.EE.B.6
CCSS.8.F.A.3
6.
MULTIPLE CHOICE QUESTION
30 sec • 1 pt
What is the slope of the line represented by the equation y = 3x - 2?
2
-2
-3
3
Tags
CCSS.8.EE.B.5
7.
MULTIPLE CHOICE QUESTION
30 sec • 1 pt
What is the y-intercept of the equation y = 3x - 2?
2
3
-2
-3
Tags
CCSS.8.EE.B.6
CCSS.8.F.A.3
Access all questions and much more by creating a free account
Create resources
Host any resource
Get auto-graded reports
Continue with Google

Continue with Email
Continue with Classlink
Continue with Clever
or continue with
Microsoft
%20(1).png)
Apple
Others
Already have an account?
Popular Resources on Wayground

7 questions
History of Valentine's Day
Interactive video
•
4th Grade
15 questions
Fractions on a Number Line
Quiz
•
3rd Grade
20 questions
Equivalent Fractions
Quiz
•
3rd Grade
25 questions
Multiplication Facts
Quiz
•
5th Grade
22 questions
fractions
Quiz
•
3rd Grade
15 questions
Valentine's Day Trivia
Quiz
•
3rd Grade
20 questions
Main Idea and Details
Quiz
•
5th Grade
20 questions
Context Clues
Quiz
•
6th Grade
Discover more resources for Mathematics
20 questions
Graphing Inequalities on a Number Line
Quiz
•
6th - 9th Grade
20 questions
Exponent Properties
Quiz
•
9th Grade
15 questions
Combine Like Terms and Distributive Property
Quiz
•
8th - 9th Grade
20 questions
Function or Not a Function
Quiz
•
8th - 9th Grade
10 questions
Factor Quadratic Expressions with Various Coefficients
Quiz
•
9th - 12th Grade
10 questions
Elijah McCoy: Innovations and Impact in Black History
Interactive video
•
6th - 10th Grade
10 questions
Evaluating Piecewise Functions Practice
Quiz
•
11th Grade
21 questions
Factoring Trinomials (a=1)
Quiz
•
9th Grade