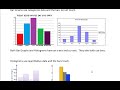
Differentiating Bar Graphs and Histograms
Interactive Video
•
Mathematics
•
1st - 5th Grade
•
Practice Problem
•
Hard
+1
Standards-aligned

Mia Campbell
FREE Resource
Standards-aligned
Read more
5 questions
Show all answers
1.
MULTIPLE CHOICE QUESTION
30 sec • 1 pt
What type of data do bar graphs typically represent?
None of the above
Continuous data
Categorical data
Quantitative data
Tags
CCSS.2.MD.D.10
2.
MULTIPLE CHOICE QUESTION
30 sec • 1 pt
In a bar graph, how are the bars positioned in relation to each other?
Bars overlap each other
Bars touch each other
There are gaps between the bars
Bars are randomly placed
Tags
CCSS.2.MD.D.10
3.
MULTIPLE CHOICE QUESTION
30 sec • 1 pt
Which of the following is an example of data typically shown in a bar graph?
Temperature over a year
Types of pets owned by people
Population growth over decades
Sales figures over quarters
Tags
CCSS.2.MD.D.9
4.
MULTIPLE CHOICE QUESTION
30 sec • 1 pt
What distinguishes a histogram from a bar graph regarding the data it uses?
Uses quantitative data
Uses categorical data
Uses none of the above
Uses qualitative data
Tags
CCSS.6.SP.B.4
CCSS.HSS.ID.A.1
5.
MULTIPLE CHOICE QUESTION
30 sec • 1 pt
In histograms, how are the bars positioned?
Bars do not touch each other
Bars are arranged randomly
Bars are spaced evenly
Bars touch each other
Tags
CCSS.6.SP.B.4
CCSS.HSS.ID.A.1
Access all questions and much more by creating a free account
Create resources
Host any resource
Get auto-graded reports
Continue with Google

Continue with Email
Continue with Classlink
Continue with Clever
or continue with
Microsoft
%20(1).png)
Apple
Others
Already have an account?
Similar Resources on Wayground

6 questions
Hearse and convoy enters Mandela's Mvezo compound
Interactive video
•
1st - 2nd Grade
11 questions
Understanding Pie Charts Concepts
Interactive video
•
5th - 6th Grade
8 questions
Median, Mean, Mode, and Range
Interactive video
•
6th - 7th Grade
6 questions
Big explosion in the centre of Pristina
Interactive video
•
6th - 8th Grade
6 questions
Palestinian president touring West Bank city of Hebron
Interactive video
•
6th - 8th Grade
6 questions
CLEAN : Gunman kills three in Swiss village
Interactive video
•
6th - 8th Grade
6 questions
WRAP Two Palestinians die at checkpoint, Israelis in Hebron
Interactive video
•
1st - 2nd Grade
6 questions
CLEAN : Iranian officials mourn ex-president Rafsandjani
Interactive video
•
1st - 2nd Grade
Popular Resources on Wayground
15 questions
Fractions on a Number Line
Quiz
•
3rd Grade
10 questions
Probability Practice
Quiz
•
4th Grade
15 questions
Probability on Number LIne
Quiz
•
4th Grade
20 questions
Equivalent Fractions
Quiz
•
3rd Grade
25 questions
Multiplication Facts
Quiz
•
5th Grade
22 questions
fractions
Quiz
•
3rd Grade
6 questions
Appropriate Chromebook Usage
Lesson
•
7th Grade
10 questions
Greek Bases tele and phon
Quiz
•
6th - 8th Grade
Discover more resources for Mathematics
10 questions
Probability Practice
Quiz
•
4th Grade
15 questions
Fractions on a Number Line
Quiz
•
3rd Grade
20 questions
Equivalent Fractions
Quiz
•
3rd Grade
15 questions
Probability on Number LIne
Quiz
•
4th Grade
25 questions
Multiplication Facts
Quiz
•
5th Grade
22 questions
fractions
Quiz
•
3rd Grade
15 questions
Equivalent Fractions
Quiz
•
4th Grade
18 questions
Comparing Fractions with same numerator or denominator
Quiz
•
3rd Grade