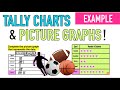
Exploring Tally Charts and Picture Graphs
Interactive Video
•
Mathematics
•
1st - 5th Grade
•
Practice Problem
•
Medium
+9
Standards-aligned

Emma Peterson
Used 16+ times
FREE Resource
Standards-aligned
10 questions
Show all answers
1.
MULTIPLE CHOICE QUESTION
30 sec • 1 pt
What symbol is used in the picture graph to represent each student's favorite sport?
Triangle
Circle
Star
Square
Tags
CCSS.2.MD.D.10
2.
MULTIPLE CHOICE QUESTION
30 sec • 1 pt
How many stars represent baseball in the picture graph?
Two
Six
Five
Four
Tags
CCSS.1.MD.C.4
3.
MULTIPLE CHOICE QUESTION
30 sec • 1 pt
Which sport had six tallies in the tally chart?
Basketball
Soccer
Hockey
Football
Tags
CCSS.5.G.A.2
4.
MULTIPLE CHOICE QUESTION
30 sec • 1 pt
How many students chose hockey as their favorite sport?
Six
Eight
Two
Five
Tags
CCSS.1.MD.C.4
5.
MULTIPLE CHOICE QUESTION
30 sec • 1 pt
How many stars should be placed for football in the picture graph?
Five
Two
Eight
Six
Tags
CCSS.2.MD.D.10
6.
MULTIPLE CHOICE QUESTION
30 sec • 1 pt
Which sport was the most popular in Miss Lyle's class?
Soccer
Football
Baseball
Basketball
Tags
CCSS.1.MD.C.4
7.
MULTIPLE CHOICE QUESTION
30 sec • 1 pt
What is the purpose of using a picture graph to represent data?
To visually simplify the representation of data
None of the above
To confuse the viewer
To make data harder to understand
Tags
CCSS.2.MD.D.10
Access all questions and much more by creating a free account
Create resources
Host any resource
Get auto-graded reports
Continue with Google

Continue with Email
Continue with Microsoft
or continue with

%20(1).png)
Apple
Others
Already have an account?
