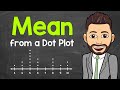
Finding the Mean from a Dot Plot
Interactive Video
•
English
•
1st - 5th Grade
•
Practice Problem
•
Hard
+5
Standards-aligned

Jackson Turner
FREE Resource
Standards-aligned
10 questions
Show all answers
1.
MULTIPLE CHOICE QUESTION
30 sec • 1 pt
What is another common term for 'mean' in statistics?
Median
Average
Mode
Range
Tags
CCSS.6.SP.B.5C
2.
MULTIPLE CHOICE QUESTION
30 sec • 1 pt
How do you calculate the mean of a set of numbers?
None of the above
Multiply all numbers and take the square root
Add all numbers and divide by the total count
Divide the sum of numbers by the maximum value
Tags
CCSS.6.SP.B.5C
3.
MULTIPLE CHOICE QUESTION
30 sec • 1 pt
What is the purpose of using a dot plot in finding the mean?
To calculate the median
To simplify the addition process
To visualize data distribution
To find the mode of the data
Tags
CCSS.6.SP.B.4
CCSS.HSS.ID.A.1
4.
MULTIPLE CHOICE QUESTION
30 sec • 1 pt
How many bike rides were recorded in the dot plot example?
20
22
18
15
Tags
CCSS.6.SP.B.5A
5.
MULTIPLE CHOICE QUESTION
30 sec • 1 pt
What is the sum of all bike ride distances from the dot plot?
120
130
100
112
Tags
CCSS.6.SP.B.5A
6.
MULTIPLE CHOICE QUESTION
30 sec • 1 pt
What is the calculated mean of the bike ride distances?
6.22
7.0
5.5
6.5
Tags
CCSS.6.SP.B.5C
7.
MULTIPLE CHOICE QUESTION
30 sec • 1 pt
How is a repeating decimal indicated in the results?
Using an asterisk (*)
With a bar above the repeating number
By rounding up
By writing 'repeat'
Tags
CCSS.7.NS.A.2D
CCSS.8.NS.A.1
Access all questions and much more by creating a free account
Create resources
Host any resource
Get auto-graded reports
Continue with Google

Continue with Email
Continue with Classlink
Continue with Clever
or continue with
Microsoft
%20(1).png)
Apple
Others
Already have an account?
Similar Resources on Wayground
Popular Resources on Wayground

15 questions
Fractions on a Number Line
Quiz
•
3rd Grade
20 questions
Equivalent Fractions
Quiz
•
3rd Grade
25 questions
Multiplication Facts
Quiz
•
5th Grade
54 questions
Analyzing Line Graphs & Tables
Quiz
•
4th Grade
22 questions
fractions
Quiz
•
3rd Grade
20 questions
Main Idea and Details
Quiz
•
5th Grade
20 questions
Context Clues
Quiz
•
6th Grade
15 questions
Equivalent Fractions
Quiz
•
4th Grade
Discover more resources for English
20 questions
Main Idea and Details
Quiz
•
5th Grade
14 questions
Nonfiction Text Structures
Quiz
•
4th Grade
10 questions
Context Clues
Quiz
•
3rd Grade
12 questions
Figurative Language Review
Interactive video
•
5th Grade
20 questions
Prefix and Suffix Review
Quiz
•
3rd - 5th Grade
20 questions
Character perspective, theme, summarize, author's purpose
Quiz
•
5th Grade
20 questions
Shifts in Verb Tenses
Quiz
•
5th Grade
20 questions
Figurative Language
Quiz
•
5th Grade