Creating and Interpreting Picture Graphs
Interactive Video
•
Mathematics
•
1st - 5th Grade
•
Practice Problem
•
Hard
+4
Standards-aligned

Liam Anderson
FREE Resource
Standards-aligned
Read more
10 questions
Show all answers
1.
MULTIPLE CHOICE QUESTION
30 sec • 1 pt
What does each symbol in a picture graph represent?
A fixed amount of data
A variable amount of people
Different colors
A specific type of data
Tags
CCSS.2.MD.D.10
2.
MULTIPLE CHOICE QUESTION
30 sec • 1 pt
What does each smile face in the picture graph represent?
Two students
One student
Five students
Ten students
Tags
CCSS.1.MD.C.4
3.
MULTIPLE CHOICE QUESTION
30 sec • 1 pt
How are tally marks grouped when counting?
In tens
In fives
Individually
In threes
Tags
CCSS.2.OA.C.3
4.
MULTIPLE CHOICE QUESTION
30 sec • 1 pt
What is the first step in converting tally chart data into a picture graph?
Count the total tallies
Draw a picture for each tally
Draw a smiley for each data point
Label the graph
Tags
CCSS.2.MD.D.10
5.
MULTIPLE CHOICE QUESTION
30 sec • 1 pt
What should you do if you lack colored cubes for the graphing exercise?
Draw the cubes
Cancel the exercise
Use colored pencils instead
Use pieces of colored paper
Tags
CCSS.2.MD.D.9
6.
MULTIPLE CHOICE QUESTION
30 sec • 1 pt
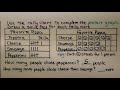
How many smile faces should be drawn for sausage in the pizza toppings graph?
Six
Five
Three
Four
Tags
CCSS.2.MD.D.10
7.
MULTIPLE CHOICE QUESTION
30 sec • 1 pt
How many more people chose cheese over sausage in the pizza toppings graph?
One
Three
Two
Four
Tags
CCSS.3.OA.D.8
Access all questions and much more by creating a free account
Create resources
Host any resource
Get auto-graded reports
Continue with Google

Continue with Email
Continue with Microsoft
or continue with

%20(1).png)
Apple
Others
Already have an account?
