Reading Different Types of Graphs
Interactive Video
•
Mathematics
•
1st - 5th Grade
•
Practice Problem
•
Medium
+2
Standards-aligned

Liam Anderson
Used 10+ times
FREE Resource
Standards-aligned
10 questions
Show all answers
1.
MULTIPLE CHOICE QUESTION
30 sec • 1 pt
What is the primary purpose of using bar graphs?
To represent parts of a whole
To display correlations
To compare different categories
To show changes over time
Tags
CCSS.2.MD.D.10
2.
MULTIPLE CHOICE QUESTION
30 sec • 1 pt
How can you visually compare categories using a bar graph?
By the area of the circles
By the scatter of points
By the slope of a line
By the length of the bars
Tags
CCSS.2.MD.D.10
3.
MULTIPLE CHOICE QUESTION
30 sec • 1 pt
Which graph type is typically used to represent data changes over time?
Line graph
Bar graph
Scatter plot
Pie graph
4.
MULTIPLE CHOICE QUESTION
30 sec • 1 pt
What does a spiky line graph typically indicate?
Stable data
No changes
Regular intervals
Frequent changes
Tags
CCSS.6.SP.B.5C
CCSS.HSS.ID.A.3
5.
MULTIPLE CHOICE QUESTION
30 sec • 1 pt
What does a line of best fit in a scatter plot indicate?
The average value of the data
The exact values of data points
The maximum and minimum values
The trend or correlation in the data
Tags
CCSS.8.SP.A.2
6.
MULTIPLE CHOICE QUESTION
30 sec • 1 pt
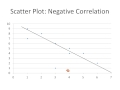
What type of correlation does a downward trending line of best fit indicate in a scatter plot?
Cannot be determined
No correlation
Positive correlation
Negative correlation
Tags
CCSS.HSS.ID.B.5
7.
MULTIPLE CHOICE QUESTION
30 sec • 1 pt
What is a negative correlation in a scatter plot likely to show?
All variables are independent
Increase in one variable leads to decrease in another
Increase in one variable leads to increase in another
No relationship between variables
Tags
CCSS.HSS.ID.B.5
Access all questions and much more by creating a free account
Create resources
Host any resource
Get auto-graded reports
Continue with Google

Continue with Email
Continue with Microsoft
or continue with

%20(1).png)
Apple
Others
Already have an account?
