Understanding Frequency Tables and Tally Marks
Interactive Video
•
Mathematics, Education, Life Skills
•
3rd - 5th Grade
•
Practice Problem
•
Medium

Lucas Foster
Used 7+ times
FREE Resource
Read more
10 questions
Show all answers
1.
MULTIPLE CHOICE QUESTION
30 sec • 1 pt
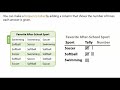
How many different sports did the students name in the survey?
Two
Three
Four
Five
2.
MULTIPLE CHOICE QUESTION
30 sec • 1 pt
What is the term used for the information collected in a survey?
Data
Numbers
Statistics
Figures
3.
MULTIPLE CHOICE QUESTION
30 sec • 1 pt
What tool can you use to help record data for each sport?
Lists
Charts
Tallies
Graphs
4.
MULTIPLE CHOICE QUESTION
30 sec • 1 pt
How do you make a tally mark for soccer in the data?
Draw a circle
Make a tally mark
Write the word 'soccer'
Draw a star
5.
MULTIPLE CHOICE QUESTION
30 sec • 1 pt
What should you write in the left column of the tally chart?
Survey questions
Survey answers
Total counts
Tally marks
6.
MULTIPLE CHOICE QUESTION
30 sec • 1 pt
What additional column is added to create a frequency table?
Number of times each answer is given
Total tally marks
Survey answers
Survey questions
7.
MULTIPLE CHOICE QUESTION
30 sec • 1 pt
Where does the title of the frequency table come from?
The survey question
The survey data title
The tally chart
The number of responses
Access all questions and much more by creating a free account
Create resources
Host any resource
Get auto-graded reports
Continue with Google

Continue with Email
Continue with Classlink
Continue with Clever
or continue with
Microsoft
%20(1).png)
Apple
Others
Already have an account?
