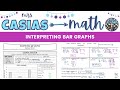
Interpreting Bar Graphs in 7th Grade Math
Interactive Video
•
Mathematics
•
6th - 10th Grade
•
Practice Problem
•
Easy
+1
Standards-aligned

Ethan Morris
Used 7+ times
FREE Resource
Standards-aligned
Read more
10 questions
Show all answers
1.
MULTIPLE CHOICE QUESTION
30 sec • 1 pt
What does a bar graph use to represent categorical data?
Dotted lines
Pie slices
Scatter plots
Solid bars
Tags
CCSS.2.MD.D.10
2.
MULTIPLE CHOICE QUESTION
30 sec • 1 pt
How many poodles were groomed according to the bar graph?
8
12
20
25
Tags
CCSS.3.MD.B.3
3.
MULTIPLE CHOICE QUESTION
30 sec • 1 pt
What is the total number of dogs groomed?
100
50
80
70
Tags
CCSS.3.MD.B.3
4.
MULTIPLE CHOICE QUESTION
30 sec • 1 pt
What percentage of the dogs groomed were poodles?
25%
15%
30%
10%
5.
MULTIPLE CHOICE QUESTION
30 sec • 1 pt
What percentage of the dogs groomed were pugs?
10%
5%
25%
20%
6.
MULTIPLE CHOICE QUESTION
30 sec • 1 pt
What is the ratio of pugs and Yorkies to Malteses?
1:1
2:3
4:3
3:4
Tags
CCSS.6.RP.A.1
CCSS.6.RP.A.2
7.
MULTIPLE CHOICE QUESTION
30 sec • 1 pt
Which breed represents 15% of the total dogs groomed?
Malteses
Dachshunds
Poodles
Schnauzers
Access all questions and much more by creating a free account
Create resources
Host any resource
Get auto-graded reports
Continue with Google

Continue with Email
Continue with Classlink
Continue with Clever
or continue with
Microsoft
%20(1).png)
Apple
Others
Already have an account?
Popular Resources on Wayground

8 questions
Spartan Way - Classroom Responsible
Quiz
•
9th - 12th Grade
15 questions
Fractions on a Number Line
Quiz
•
3rd Grade
14 questions
Boundaries & Healthy Relationships
Lesson
•
6th - 8th Grade
20 questions
Equivalent Fractions
Quiz
•
3rd Grade
3 questions
Integrity and Your Health
Lesson
•
6th - 8th Grade
25 questions
Multiplication Facts
Quiz
•
5th Grade
9 questions
FOREST Perception
Lesson
•
KG
20 questions
Main Idea and Details
Quiz
•
5th Grade
Discover more resources for Mathematics
12 questions
Review: Surface Area of Rectangular and Triangular Prisms
Quiz
•
6th Grade
20 questions
Scatter Plots and Line of Best Fit
Quiz
•
8th Grade
36 questions
6th Grade Math STAAR Review
Quiz
•
6th Grade
12 questions
8th U6 L4 - Fitting a Line to Data
Quiz
•
8th Grade
14 questions
Volume of rectangular prisms
Quiz
•
7th Grade
25 questions
Scatter Plots and Line of Best Fit
Quiz
•
8th Grade
14 questions
finding slope from a graph
Quiz
•
8th Grade
20 questions
Graphing Inequalities on a Number Line
Quiz
•
6th - 9th Grade