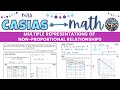
Exploring Non-Proportional Linear Relationships
Interactive Video
•
Mathematics
•
6th - 10th Grade
•
Practice Problem
•
Hard
+4
Standards-aligned

Jackson Turner
FREE Resource
Standards-aligned
Read more
10 questions
Show all answers
1.
MULTIPLE CHOICE QUESTION
30 sec • 1 pt
What does 'm' represent in the equation y = mx + b?
The rate of change
The total cost
The initial value
The number of miles
Tags
CCSS.8.EE.B.6
CCSS.8.F.A.3
2.
MULTIPLE CHOICE QUESTION
30 sec • 1 pt
What is the rate of change for the taxi fare scenario?
$3 per mile
$2 per mile
$4 per mile
$5 per mile
Tags
CCSS.HSF-LE.A.1B
3.
MULTIPLE CHOICE QUESTION
30 sec • 1 pt
What is the total cost for 4 miles in the taxi scenario?
$14
$12
$11
$8
Tags
CCSS.6.RP.A.3B
4.
MULTIPLE CHOICE QUESTION
30 sec • 1 pt
At 0 miles, what is the initial cost in the taxi scenario?
$2
$5
$0
$3
Tags
CCSS.HSF.LE.B.5
5.
MULTIPLE CHOICE QUESTION
30 sec • 1 pt
How is the y-axis labeled in the graph of the taxi fare scenario?
Rate of Change
Dollars
Number of Trips
Miles
Tags
CCSS.8.EE.B.5
6.
MULTIPLE CHOICE QUESTION
30 sec • 1 pt
What is the y-intercept in the kite descending scenario?
20 feet
17 feet
1.5 feet
0 feet
Tags
CCSS.HSF-IF.C.7A
7.
MULTIPLE CHOICE QUESTION
30 sec • 1 pt
How much does the kite descend per second?
2.5 feet
2 feet
1.5 feet
1 foot
Tags
CCSS.8.EE.B.5
Access all questions and much more by creating a free account
Create resources
Host any resource
Get auto-graded reports
Continue with Google

Continue with Email
Continue with Classlink
Continue with Clever
or continue with
Microsoft
%20(1).png)
Apple
Others
Already have an account?
