- Resource Library
- Math
- Probability And Statistics
- Bivariate Data
- Exploring Scatter Plots And Bivariate Data
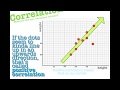
Exploring Scatter Plots and Bivariate Data
Interactive Video
•
Mathematics
•
6th - 10th Grade
•
Practice Problem
•
Medium
Standards-aligned

Amelia Wright
Used 48+ times
FREE Resource
Standards-aligned
10 questions
Show all answers
1.
MULTIPLE CHOICE QUESTION
30 sec • 1 pt
What does 'bivariate' mean in the context of data?
Data that varies twice as much
Data collected over two years
Data with binary values
Data with two variables
Tags
CCSS.6.SP.B.5A
2.
MULTIPLE CHOICE QUESTION
30 sec • 1 pt
Which of the following is an example of bivariate data?
Favorite genres of music
Color preferences among individuals
Population of a city
Temperature over time
Tags
CCSS.6.SP.B.5A
3.
MULTIPLE CHOICE QUESTION
30 sec • 1 pt
How can bivariate data be displayed apart from scatter plots?
Input-output tables
Histograms
Frequency polygons
Stem-and-leaf plots
4.
MULTIPLE CHOICE QUESTION
30 sec • 1 pt
How is bivariate data best represented?
Using a line chart
Through a bar graph
On a scatter plot
In a pie chart
5.
MULTIPLE CHOICE QUESTION
30 sec • 1 pt
What is the purpose of plotting bivariate data on a graph?
To identify the mode of the dataset
To determine the median value of the dataset
To calculate the mean of the variables
To visualize the relationship between two variables
Tags
CCSS.8.SP.A.1
6.
MULTIPLE CHOICE QUESTION
30 sec • 1 pt
What does a scatter plot illustrate about bivariate data?
The difference between two sets of data
The average value of the data set
The correlation between two variables
The total sum of all data points
Tags
CCSS.8.SP.A.1
7.
MULTIPLE CHOICE QUESTION
30 sec • 1 pt
What does a scatter plot with no clear pattern suggest?
A strong correlation
No correlation
Only positive correlation
Only negative correlation
Tags
CCSS.HSS.ID.B.5
Access all questions and much more by creating a free account
Create resources
Host any resource
Get auto-graded reports
Continue with Google

Continue with Email
Continue with Microsoft
or continue with

%20(1).png)
Apple
Others
Already have an account?
