Exploring Scatter Plots
Interactive Video
•
Mathematics
•
6th - 10th Grade
•
Practice Problem
•
Easy
Standards-aligned

Sophia Harris
Used 17+ times
FREE Resource
Standards-aligned
Read more
10 questions
Show all answers
1.
MULTIPLE CHOICE QUESTION
30 sec • 1 pt
What does a scatter plot primarily display?
Categorical data only
Univariate numerical data
Textual analysis data
Bivariate numerical data
Tags
CCSS.8.SP.A.1
2.
MULTIPLE CHOICE QUESTION
30 sec • 1 pt
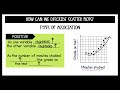
What does a positive association in a scatter plot indicate?
As one variable increases, the other decreases
No relationship between the variables
As one variable increases, the other also increases
Random distribution of data points
Tags
CCSS.HSS.ID.B.5
3.
MULTIPLE CHOICE QUESTION
30 sec • 1 pt
Which of the following best describes a scatter plot with a negative association?
Points move upward from left to right
Points are randomly distributed with no clear pattern
Points move downward from left to right
All points lie on a straight line
4.
MULTIPLE CHOICE QUESTION
30 sec • 1 pt
What does a scatter plot with no association show?
Two distinct clusters of data points
All points aligned in a straight line
Data points scattered randomly without a pattern
A clear upward or downward trend
Tags
CCSS.HSS.ID.B.5
5.
MULTIPLE CHOICE QUESTION
30 sec • 1 pt
In a scatter plot showing the relationship between study time and test grades, what kind of association would you expect?
No association
Positive
Negative
Non-linear
Tags
CCSS.HSS.ID.B.5
6.
MULTIPLE CHOICE QUESTION
30 sec • 1 pt
What is an outlier in the context of scatter plots?
A data point that does not fit the overall trend
A data point that lies within a cluster
A data point that follows the trend
The highest data point in the plot
Tags
CCSS.8.SP.A.1
7.
MULTIPLE CHOICE QUESTION
30 sec • 1 pt
What does it mean if a scatter plot is described as linear?
It shows a positive association only
Data points follow the path of a curve
Data points follow the path of a straight line
It contains multiple clusters of data points
Tags
CCSS.HSS.ID.B.5
Access all questions and much more by creating a free account
Create resources
Host any resource
Get auto-graded reports
Continue with Google

Continue with Email
Continue with Microsoft
or continue with

%20(1).png)
Apple
Others
Already have an account?
