Exploring Two Way Tables in Lesson 4.3
Interactive Video
•
Mathematics
•
6th - 10th Grade
•
Practice Problem
•
Hard
Standards-aligned

Olivia Brooks
FREE Resource
Standards-aligned
Read more
10 questions
Show all answers
1.
MULTIPLE CHOICE QUESTION
30 sec • 1 pt
What is a two-way table?
A table showing data for one variable
A statistical table showing observed frequencies for two categories
A method for calculating averages
A type of graph for plotting data points
Tags
CCSS.8.SP.A.4
2.
MULTIPLE CHOICE QUESTION
30 sec • 1 pt
What do the rows in a two-way table represent?
The total of all categories
A single category being measured
One of the two categories being compared
The grand total of observations
Tags
CCSS.8.SP.A.4
3.
MULTIPLE CHOICE QUESTION
30 sec • 1 pt
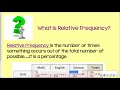
How do you calculate relative frequency from a two-way table?
Subtract the smallest frequency from the largest
Multiply the row total by the column total
Add all the frequencies together
Divide the category total by the grand total and multiply by 100
Tags
CCSS.8.SP.A.4
4.
MULTIPLE CHOICE QUESTION
30 sec • 1 pt
What is the grand total of students in the example given?
315 students
165 students
215 students
150 students
Tags
CCSS.6.SP.B.5A
5.
MULTIPLE CHOICE QUESTION
30 sec • 1 pt
What percentage of girls are in math class?
50%
27%
33%
40%
6.
MULTIPLE CHOICE QUESTION
30 sec • 1 pt
What is the total percentage when adding up the relative frequencies for math, English, and science?
100%
90%
110%
95%
Tags
CCSS.8.SP.A.4
7.
MULTIPLE CHOICE QUESTION
30 sec • 1 pt
How do you find the percentage of people over 40 against increasing the minimum wage?
Subtract the number of people for increasing the wage from the total
Multiply the total frequency by the number of people over 40
Divide the frequency of people over 40 by 70 and multiply by 100
Add the frequencies of all age groups and divide by 70
Tags
CCSS.8.SP.A.4
Access all questions and much more by creating a free account
Create resources
Host any resource
Get auto-graded reports
Continue with Google

Continue with Email
Continue with Classlink
Continue with Clever
or continue with
Microsoft
%20(1).png)
Apple
Others
Already have an account?
