- Resource Library
- Math
- Data And Graphing
- Characteristics Of Graphs
- Exploring Graphs Of Proportional Relationships
Exploring Graphs of Proportional Relationships
Interactive Video
•
Mathematics
•
6th - 10th Grade
•
Practice Problem
•
Medium
+3
Standards-aligned

Ethan Morris
Used 6+ times
FREE Resource
Standards-aligned
Read more
10 questions
Show all answers
1.
MULTIPLE CHOICE QUESTION
30 sec • 1 pt
What is the first step in plotting points for a graph of proportional relationships?
Start with the highest value
Identify the origin
Plot along the x-axis first
Plot along the y-axis first
Tags
CCSS.7.RP.A.2D
2.
MULTIPLE CHOICE QUESTION
30 sec • 1 pt
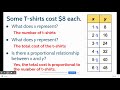
What does the x-value represent in the t-shirt sale example?
The size of t-shirts
The number of t-shirts
The price per t-shirt
The total cost of t-shirts
Tags
CCSS.5.OA.B.3
3.
MULTIPLE CHOICE QUESTION
30 sec • 1 pt
What does the y-value represent in the t-shirt sale example?
The color of t-shirts
The size of t-shirts
The total cost of t-shirts
The number of t-shirts
Tags
CCSS.5.OA.B.3
4.
MULTIPLE CHOICE QUESTION
30 sec • 1 pt
What does the constant of proportionality represent in the t-shirt example?
The total number of t-shirts available
The price per t-shirt
The discount on bulk purchases
The total cost for all t-shirts
Tags
CCSS.7.RP.A.2B
5.
MULTIPLE CHOICE QUESTION
30 sec • 1 pt
Can you buy half of a t-shirt according to the graph discussed?
No, because a t-shirt is a whole item
Yes, at half the price
Yes, but only in special cases
No, because it's not allowed in the store
Tags
CCSS.3.NF.A.1
CCSS.3.NF.A.2B
6.
MULTIPLE CHOICE QUESTION
30 sec • 1 pt
Is it possible to buy zero t-shirts according to the graph?
Yes, and it costs nothing
No, you must buy at least one
Yes, but it costs half the price of one t-shirt
No, because zero is not represented on the graph
Tags
CCSS.7.RP.A.3
7.
MULTIPLE CHOICE QUESTION
30 sec • 1 pt
Why can't you buy half of a t-shirt in the given example?
Because half a t-shirt is not a standard sale item
Because the store does not sell t-shirts in fractions
Because the graph does not allow for fractional quantities
Because it's not physically possible to have half a t-shirt
Tags
CCSS.3.NF.A.1
CCSS.3.NF.A.2B
Access all questions and much more by creating a free account
Create resources
Host any resource
Get auto-graded reports
Continue with Google

Continue with Email
Continue with Microsoft
or continue with

%20(1).png)
Apple
Others
Already have an account?
