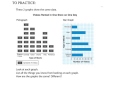
Comparing Pictographs and Bar Graphs
Interactive Video
•
Mathematics
•
6th - 10th Grade
•
Practice Problem
•
Medium
Standards-aligned

Liam Anderson
Used 4+ times
FREE Resource
Standards-aligned
10 questions
Show all answers
1.
MULTIPLE CHOICE QUESTION
30 sec • 1 pt
What does each symbol in the pictograph represent in the Fun Times Park example?
20 people per symbol
50 people per symbol
10 people per symbol
30 people per symbol
Tags
CCSS.3.MD.B.3
2.
MULTIPLE CHOICE QUESTION
30 sec • 1 pt
What was identified as a problem in the bar graph example?
The colors were not distinct.
The bars were too close together.
The scale was not clear.
There was no number at the end of the bars.
Tags
CCSS.3.MD.B.3
3.
MULTIPLE CHOICE QUESTION
30 sec • 1 pt
Which graph type is generally easier to estimate numbers from?
Line graph
Pictograph
Bar graph
Pie chart
4.
MULTIPLE CHOICE QUESTION
30 sec • 1 pt
Which type of graph was preferred by the teacher?
Histogram
Pictograph
Line graph
Bar graph
5.
MULTIPLE CHOICE QUESTION
30 sec • 1 pt
How are the bars oriented in the bar graph discussed?
Circularly
Diagonally
Horizontally
Vertically
Tags
CCSS.2.MD.D.10
6.
MULTIPLE CHOICE QUESTION
30 sec • 1 pt
Why are bar graphs generally preferred over pictographs according to the lesson?
They use less paper
They are more colorful
They are easier to draw
They make estimating numbers easier
Tags
CCSS.2.MD.D.10
7.
MULTIPLE CHOICE QUESTION
30 sec • 1 pt
In the video store example, what was the least popular type of video rented?
Romance
Action
Comedy
Kids movies
Tags
CCSS.2.MD.D.10
Access all questions and much more by creating a free account
Create resources
Host any resource
Get auto-graded reports
Continue with Google

Continue with Email
Continue with Classlink
Continue with Clever
or continue with
Microsoft
%20(1).png)
Apple
Others
Already have an account?
