Comparing Pictographs and Bar Graphs
Interactive Video
•
Mathematics
•
6th - 10th Grade
•
Practice Problem
•
Medium
+1
Standards-aligned

Liam Anderson
Used 2+ times
FREE Resource
Standards-aligned
10 questions
Show all answers
1.
MULTIPLE CHOICE QUESTION
30 sec • 1 pt
What is the main purpose of Lesson Four?
To compare pictographs and bar graphs
To learn about music preferences
To review previous lessons
To create a new type of graph
Tags
CCSS.HSS.ID.A.3
2.
MULTIPLE CHOICE QUESTION
30 sec • 1 pt
What does the MP3 player symbol represent in the pictograph?
One student
Two students
Three students
Four students
Tags
CCSS.3.MD.B.3
3.
MULTIPLE CHOICE QUESTION
30 sec • 1 pt
How many students chose rock as their favorite music according to the pictograph?
9
8
7
6
Tags
CCSS.1.MD.C.4
4.
MULTIPLE CHOICE QUESTION
30 sec • 1 pt
Which graph type provides a visual representation using symbols?
Histogram
Line graph
Bar graph
Pictograph
5.
MULTIPLE CHOICE QUESTION
30 sec • 1 pt
What is a key difference between pictographs and bar graphs?
Pictographs are more accurate
Bar graphs use symbols
Pictographs use bars
Bar graphs have a scale
Tags
CCSS.2.MD.D.10
6.
MULTIPLE CHOICE QUESTION
30 sec • 1 pt
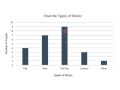
According to the bar graph, how many people chose hip hop as their favorite music?
7
10
8
9
Tags
CCSS.3.MD.B.3
7.
MULTIPLE CHOICE QUESTION
30 sec • 1 pt
How many students chose 'other' as their favorite music according to the bar graph?
1
3
2
4
Tags
CCSS.2.MD.D.10
Access all questions and much more by creating a free account
Create resources
Host any resource
Get auto-graded reports
Continue with Google

Continue with Email
Continue with Microsoft
or continue with

%20(1).png)
Apple
Others
Already have an account?
