Exploring Line Plots for Second Graders
Interactive Video
•
Mathematics
•
6th - 10th Grade
•
Practice Problem
•
Hard
Standards-aligned

Lucas Foster
FREE Resource
Standards-aligned
Read more
10 questions
Show all answers
1.
MULTIPLE CHOICE QUESTION
30 sec • 1 pt
What is the first step in creating a line plot according to the video?
Drawing a line and marking the data points
Measuring the items to be plotted
Labeling the line plot
Deciding on the scale of the plot
Tags
CCSS.3.MD.B.4
2.
MULTIPLE CHOICE QUESTION
30 sec • 1 pt
What is the height of the tallest toy giraffe mentioned?
5 inches
6 inches
8 inches
7 inches
Tags
CCSS.2.MD.A.3
3.
MULTIPLE CHOICE QUESTION
30 sec • 1 pt
Why is it important to include all numbers along the line plot?
To show which data points are missing
To account for potential data errors
To make the plot look complete
To ensure accuracy of data representation
Tags
CCSS.3.MD.B.4
4.
MULTIPLE CHOICE QUESTION
30 sec • 1 pt
How are identical data points represented on a line plot?
By using different symbols
By drawing larger Xs
By placing Xs next to each other
By stacking Xs on top of each other
Tags
CCSS.3.MD.B.4
5.
MULTIPLE CHOICE QUESTION
30 sec • 1 pt
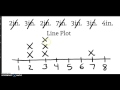
How many toys are 3 inches tall according to the line plot?
One
Two
Four
Three
Tags
CCSS.2.MD.D.9
CCSS.3.MD.B.4
6.
MULTIPLE CHOICE QUESTION
30 sec • 1 pt
What is the significance of neatly aligning Xs on the line plot?
It is a requirement for all line plots
It makes the plot easier to read
It determines the scale of the plot
It helps in identifying the tallest toy
Tags
CCSS.3.MD.B.4
7.
MULTIPLE CHOICE QUESTION
30 sec • 1 pt
What should be done after marking all data on the line plot?
Start over if a mistake is found
Immediately share the plot with others
Check that each piece of data is represented by an X
Erase unnecessary marks
Tags
CCSS.3.MD.B.4
Access all questions and much more by creating a free account
Create resources
Host any resource
Get auto-graded reports
Continue with Google

Continue with Email
Continue with Classlink
Continue with Clever
or continue with
Microsoft
%20(1).png)
Apple
Others
Already have an account?
Popular Resources on Wayground

15 questions
Fractions on a Number Line
Quiz
•
3rd Grade
20 questions
Equivalent Fractions
Quiz
•
3rd Grade
25 questions
Multiplication Facts
Quiz
•
5th Grade
29 questions
Alg. 1 Section 5.1 Coordinate Plane
Quiz
•
9th Grade
22 questions
fractions
Quiz
•
3rd Grade
11 questions
FOREST Effective communication
Lesson
•
KG
20 questions
Main Idea and Details
Quiz
•
5th Grade
20 questions
Context Clues
Quiz
•
6th Grade
Discover more resources for Mathematics
29 questions
Alg. 1 Section 5.1 Coordinate Plane
Quiz
•
9th Grade
36 questions
6th Grade Math STAAR Review
Quiz
•
6th Grade
14 questions
Volume of rectangular prisms
Quiz
•
7th Grade
14 questions
finding slope from a graph
Quiz
•
8th Grade
20 questions
Graphing Inequalities on a Number Line
Quiz
•
6th - 9th Grade
23 questions
Solve and Graph Inequalities
Quiz
•
6th Grade
15 questions
Distributive Property & Review
Quiz
•
6th Grade
10 questions
Mean, Median, Mode, and Range
Quiz
•
7th Grade