Interpreting and Drawing Pictographs for Kids
Interactive Video
•
Mathematics
•
6th - 10th Grade
•
Practice Problem
•
Hard
+4
Standards-aligned

Jackson Turner
FREE Resource
Standards-aligned
Read more
10 questions
Show all answers
1.
MULTIPLE CHOICE QUESTION
30 sec • 1 pt
What does each image in a pictograph represent?
A percentage
A different data category
A specific number of items
A random value
Tags
CCSS.3.OA.D.8
2.
MULTIPLE CHOICE QUESTION
30 sec • 1 pt
How many more chocolate-flavored ice creams were sold than strawberry-flavored?
4
3
2
1
Tags
CCSS.2.MD.D.10
3.
MULTIPLE CHOICE QUESTION
30 sec • 1 pt
Which ice-cream flavor was sold the least?
Chocolate
Strawberry
Vanilla
All were sold equally
Tags
CCSS.1.NBT.A.1
4.
MULTIPLE CHOICE QUESTION
30 sec • 1 pt
How many total ice creams were sold?
15
13
10
12
Tags
CCSS.1.OA.A.1
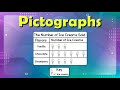
5.
MULTIPLE CHOICE QUESTION
30 sec • 1 pt
How many cars did Sam wash on Monday?
Seven
Five
Four
Three
Tags
CCSS.3.MD.B.3
6.
MULTIPLE CHOICE QUESTION
30 sec • 1 pt
On which day did Sam wash the fewest cars?
Tuesday
Thursday
Wednesday
Monday
Tags
CCSS.2.OA.A.1
7.
MULTIPLE CHOICE QUESTION
30 sec • 1 pt
How many cars did Sam wash in total over four days?
19
20
21
18
Tags
CCSS.3.MD.B.3
Access all questions and much more by creating a free account
Create resources
Host any resource
Get auto-graded reports
Continue with Google

Continue with Email
Continue with Classlink
Continue with Clever
or continue with
Microsoft
%20(1).png)
Apple
Others
Already have an account?
