Understanding Bar Graphs
Interactive Video
•
Mathematics, Education
•
4th - 8th Grade
•
Practice Problem
•
Hard
Standards-aligned

Ethan Morris
Used 2+ times
FREE Resource
Standards-aligned
Read more
10 questions
Show all answers
1.
MULTIPLE CHOICE QUESTION
30 sec • 1 pt
What is the primary purpose of a bar graph?
To show trends over time
To compare different categories
To illustrate a process
To display geographical data
Tags
CCSS.2.MD.D.10
2.
MULTIPLE CHOICE QUESTION
30 sec • 1 pt
Why might a bar graph be preferred over a pictograph?
It takes up less space
It provides a clearer comparison of data
It is easier to draw
It uses more colors
Tags
CCSS.3.MD.B.3
3.
MULTIPLE CHOICE QUESTION
30 sec • 1 pt
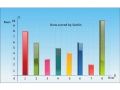
In the cricket match example, what does each bar represent?
An over of the match
A player's batting average
A player's score
A team's total runs
Tags
CCSS.3.MD.B.3
4.
MULTIPLE CHOICE QUESTION
30 sec • 1 pt
How can you determine the number of runs scored in a specific over using a bar graph?
By counting the number of bars
By checking the height of the bar
By measuring the width of the bar
By looking at the color of the bar
Tags
CCSS.2.MD.D.10
5.
MULTIPLE CHOICE QUESTION
30 sec • 1 pt
What is the first step in plotting a bar graph?
Drawing the axes
Choosing a title for the graph
Selecting a scale
Labeling the bars
Tags
CCSS.2.MD.D.10
6.
MULTIPLE CHOICE QUESTION
30 sec • 1 pt
When plotting a bar graph, what does the vertical axis typically represent?
Categories
Values or quantities
Time intervals
Colors
7.
MULTIPLE CHOICE QUESTION
30 sec • 1 pt
What is one advantage of using a bar graph?
It summarizes large data sets visually
It can be easily manipulated
It is always accurate
It requires no explanation
Access all questions and much more by creating a free account
Create resources
Host any resource
Get auto-graded reports
Continue with Google

Continue with Email
Continue with Classlink
Continue with Clever
or continue with
Microsoft
%20(1).png)
Apple
Others
Already have an account?
