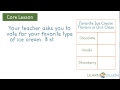
Understanding Bar Graphs
Interactive Video
•
Mathematics, Education
•
3rd - 5th Grade
•
Practice Problem
•
Medium

Amelia Wright
Used 193+ times
FREE Resource
Read more
10 questions
Show all answers
1.
MULTIPLE CHOICE QUESTION
30 sec • 1 pt
What is the purpose of the X-axis in a bar graph?
To show the number of votes
To display the categories being compared
To indicate the scale of the graph
To represent the vertical axis
2.
MULTIPLE CHOICE QUESTION
30 sec • 1 pt
What does the Y-axis represent in the ice cream bar graph?
Ice cream flavors
Number of votes
Scale increments
Types of graphs
3.
MULTIPLE CHOICE QUESTION
30 sec • 1 pt
Why is it important to label the axes on a bar graph?
To ensure everyone understands the data being represented
To make the graph colorful
To confuse the reader
To make the graph look professional
4.
MULTIPLE CHOICE QUESTION
30 sec • 1 pt
What is a common misunderstanding about the scale on the Y-axis?
It should be labeled with letters
It must always start at zero
It should always be in increments of one
It can only be in increments of five
5.
MULTIPLE CHOICE QUESTION
30 sec • 1 pt
How many students voted for vanilla as their favorite ice cream flavor?
Five
Eight
Twelve
Fourteen
6.
MULTIPLE CHOICE QUESTION
30 sec • 1 pt
Which ice cream flavor received the least number of votes?
Strawberry
Mint
Chocolate
Vanilla
7.
MULTIPLE CHOICE QUESTION
30 sec • 1 pt
What is the first step in drawing a bar on a graph?
Label the X-axis
Draw the title
Slide the scale on the Y-axis
Color the bar
Access all questions and much more by creating a free account
Create resources
Host any resource
Get auto-graded reports
Continue with Google

Continue with Email
Continue with Classlink
Continue with Clever
or continue with
Microsoft
%20(1).png)
Apple
Others
Already have an account?
Popular Resources on Wayground

7 questions
History of Valentine's Day
Interactive video
•
4th Grade
15 questions
Fractions on a Number Line
Quiz
•
3rd Grade
20 questions
Equivalent Fractions
Quiz
•
3rd Grade
25 questions
Multiplication Facts
Quiz
•
5th Grade
22 questions
fractions
Quiz
•
3rd Grade
15 questions
Valentine's Day Trivia
Quiz
•
3rd Grade
20 questions
Main Idea and Details
Quiz
•
5th Grade
20 questions
Context Clues
Quiz
•
6th Grade
Discover more resources for Mathematics
15 questions
Fractions on a Number Line
Quiz
•
3rd Grade
20 questions
Equivalent Fractions
Quiz
•
3rd Grade
25 questions
Multiplication Facts
Quiz
•
5th Grade
22 questions
fractions
Quiz
•
3rd Grade
15 questions
Equivalent Fractions
Quiz
•
4th Grade
18 questions
Comparing Fractions with same numerator or denominator
Quiz
•
3rd Grade
20 questions
Classifying Triangles
Quiz
•
5th Grade
10 questions
Area
Quiz
•
3rd Grade