Energy Bar Graphs and Thermal Changes
Interactive Video
•
Chemistry, Science
•
7th - 10th Grade
•
Practice Problem
•
Easy

Mia Campbell
Used 1+ times
FREE Resource
Read more
10 questions
Show all answers
1.
MULTIPLE CHOICE QUESTION
30 sec • 1 pt
What is the primary purpose of using energy bar graphs in physical changes?
To calculate the exact amount of energy in a system
To visually represent energy changes during physical processes
To determine the chemical composition of a substance
To measure the temperature of a system
2.
MULTIPLE CHOICE QUESTION
30 sec • 1 pt
In the context of energy bar graphs, what does the 'system' refer to?
The entire universe
The energy source
The surroundings of the object
The specific object or substance being studied
3.
MULTIPLE CHOICE QUESTION
30 sec • 1 pt
How are solids, liquids, and gases represented in energy bar graphs?
Solids: 2 bars, Liquids: 3 bars, Gases: 5 bars
Solids: 1 bar, Liquids: 2 bars, Gases: 4 bars
Solids: 3 bars, Liquids: 4 bars, Gases: 6 bars
Solids: 0 bars, Liquids: 1 bar, Gases: 2 bars
4.
MULTIPLE CHOICE QUESTION
30 sec • 1 pt
What happens to the thermal energy of the coffee as it cools?
It remains constant
It changes phase
It increases by two bars
It decreases by two bars
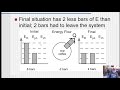
5.
MULTIPLE CHOICE QUESTION
30 sec • 1 pt
When representing the cooling of coffee, how many bars are used for hot coffee and room-temperature coffee?
Hot coffee: 2 bars, Room-temperature coffee: 4 bars
Hot coffee: 4 bars, Room-temperature coffee: 2 bars
Hot coffee: 1 bar, Room-temperature coffee: 3 bars
Hot coffee: 3 bars, Room-temperature coffee: 1 bar
6.
MULTIPLE CHOICE QUESTION
30 sec • 1 pt
What is the role of the surroundings in the energy bar graph of a cooling coffee?
To remain unaffected by the coffee
To change the phase of the coffee
To provide energy to the coffee
To absorb energy from the coffee
7.
MULTIPLE CHOICE QUESTION
30 sec • 1 pt
What does the arrow in the energy bar graph of the coffee cooling represent?
Temperature increase of the coffee
Phase change of the coffee
Energy leaving the coffee
Energy entering the coffee
Access all questions and much more by creating a free account
Create resources
Host any resource
Get auto-graded reports
Continue with Google

Continue with Email
Continue with Classlink
Continue with Clever
or continue with
Microsoft
%20(1).png)
Apple
Others
Already have an account?
