Understanding Bar Graphs
Interactive Video
•
Mathematics, Education
•
3rd - 5th Grade
•
Practice Problem
•
Hard

Olivia Brooks
FREE Resource
Read more
10 questions
Show all answers
1.
MULTIPLE CHOICE QUESTION
30 sec • 1 pt
Why is it important to watch the previous lessons before this one?
To understand the basics of bar graphs
To avoid confusion with new concepts
To get familiar with the teacher's style
To learn about different types of graphs
2.
MULTIPLE CHOICE QUESTION
30 sec • 1 pt
What is the first essential component of a bar graph?
Labels for each bar
Bars that match the data
A title with capitalized words
A scale with numbers
3.
MULTIPLE CHOICE QUESTION
30 sec • 1 pt
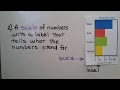
How should the scale of a bar graph be labeled?
With random numbers
With a label that explains the numbers
With colors
With letters
4.
MULTIPLE CHOICE QUESTION
30 sec • 1 pt
When creating a bar graph from a tally table, what is crucial?
Ensuring the bars match the tally data
Using the same colors
Using a scale from 0 to 5
Drawing the bars horizontally
5.
MULTIPLE CHOICE QUESTION
30 sec • 1 pt
What should you do if a number from the tally table is not on the scale?
Add a new number to the scale
Change the scale
Estimate its position between two scale numbers
Ignore the number
6.
MULTIPLE CHOICE QUESTION
30 sec • 1 pt
In a picture graph, what does a half smile face represent if a whole smile face equals two people?
Three people
Two people
One person
Four people
7.
MULTIPLE CHOICE QUESTION
30 sec • 1 pt
How would the bar graph change if a new color with double the data of green is added?
The bars would be drawn further apart
The bars would be drawn closer
The scale would need to be increased
The scale would remain the same
Access all questions and much more by creating a free account
Create resources
Host any resource
Get auto-graded reports
Continue with Google

Continue with Email
Continue with Classlink
Continue with Clever
or continue with
Microsoft
%20(1).png)
Apple
Others
Already have an account?
Similar Resources on Wayground

6 questions
Understanding Fractions of Whole Numbers
Interactive video
•
4th - 5th Grade
11 questions
Pag-aaral ng C Major Scale
Interactive video
•
3rd - 5th Grade
11 questions
Solving Systems of Linear Equations Using the Linear Combination Method
Interactive video
•
1st - 6th Grade
6 questions
Temperature
Interactive video
•
3rd Grade
6 questions
Magnetism Experiment Quiz
Interactive video
•
6th - 7th Grade
11 questions
Google Forms Reading Log Quiz
Interactive video
•
6th - 7th Grade
Popular Resources on Wayground
7 questions
History of Valentine's Day
Interactive video
•
4th Grade
15 questions
Fractions on a Number Line
Quiz
•
3rd Grade
20 questions
Equivalent Fractions
Quiz
•
3rd Grade
25 questions
Multiplication Facts
Quiz
•
5th Grade
22 questions
fractions
Quiz
•
3rd Grade
15 questions
Valentine's Day Trivia
Quiz
•
3rd Grade
20 questions
Main Idea and Details
Quiz
•
5th Grade
20 questions
Context Clues
Quiz
•
6th Grade
Discover more resources for Mathematics
15 questions
Fractions on a Number Line
Quiz
•
3rd Grade
20 questions
Equivalent Fractions
Quiz
•
3rd Grade
25 questions
Multiplication Facts
Quiz
•
5th Grade
22 questions
fractions
Quiz
•
3rd Grade
15 questions
Equivalent Fractions
Quiz
•
4th Grade
18 questions
Comparing Fractions with same numerator or denominator
Quiz
•
3rd Grade
20 questions
Classifying Triangles
Quiz
•
5th Grade
10 questions
Area
Quiz
•
3rd Grade