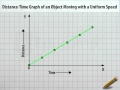
Understanding Distance-Time Graphs
Interactive Video
•
Mathematics, Physics
•
5th - 8th Grade
•
Practice Problem
•
Hard

Emma Peterson
FREE Resource
Read more
6 questions
Show all answers
1.
MULTIPLE CHOICE QUESTION
30 sec • 1 pt
What is the first step in creating a distance-time graph for an object moving at a uniform speed?
Draw a slanting line
Label the vertical axis as 'Time'
Draw horizontal dotted lines
Mark the origin on the graph sheet
2.
MULTIPLE CHOICE QUESTION
30 sec • 1 pt
When setting up the graph, what should be written below the horizontal axis?
Time
Velocity
Distance
Speed
3.
MULTIPLE CHOICE QUESTION
30 sec • 1 pt
What does the slanting straight line on the graph represent?
Deceleration
Acceleration
Uniform speed
Variable speed
4.
MULTIPLE CHOICE QUESTION
30 sec • 1 pt
How should the vertical axis be labeled on a distance-time graph?
Time
Distance
Velocity
Speed
5.
MULTIPLE CHOICE QUESTION
30 sec • 1 pt
What is the purpose of marking points T1 and T2 on the horizontal axis?
To indicate different speeds
To show time intervals
To mark acceleration
To denote distance intervals
6.
MULTIPLE CHOICE QUESTION
30 sec • 1 pt
What do the points S1 and S2 on the vertical axis represent?
Time intervals
Speed changes
Distance covered
Acceleration points
Access all questions and much more by creating a free account
Create resources
Host any resource
Get auto-graded reports
Continue with Google

Continue with Email
Continue with Classlink
Continue with Clever
or continue with
Microsoft
%20(1).png)
Apple
Others
Already have an account?
Popular Resources on Wayground

7 questions
History of Valentine's Day
Interactive video
•
4th Grade
15 questions
Fractions on a Number Line
Quiz
•
3rd Grade
20 questions
Equivalent Fractions
Quiz
•
3rd Grade
25 questions
Multiplication Facts
Quiz
•
5th Grade
22 questions
fractions
Quiz
•
3rd Grade
15 questions
Valentine's Day Trivia
Quiz
•
3rd Grade
20 questions
Main Idea and Details
Quiz
•
5th Grade
20 questions
Context Clues
Quiz
•
6th Grade
Discover more resources for Mathematics
25 questions
Multiplication Facts
Quiz
•
5th Grade
20 questions
Classifying Triangles
Quiz
•
5th Grade
10 questions
Multiplying Fractions
Quiz
•
5th Grade
20 questions
Writing Algebraic Expressions
Quiz
•
6th Grade
10 questions
Adding and Subtracting Decimals
Quiz
•
5th Grade
20 questions
Ratios/Rates and Unit Rates
Quiz
•
6th Grade
15 questions
Rounding Decimals
Quiz
•
5th Grade
14 questions
Volume of rectangular prisms
Quiz
•
7th Grade