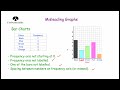
Understanding Misleading Graphs
Interactive Video
•
Mathematics, Science
•
7th - 10th Grade
•
Practice Problem
•
Hard

Emma Peterson
FREE Resource
Read more
10 questions
Show all answers
1.
MULTIPLE CHOICE QUESTION
30 sec • 1 pt
Why is it important to identify misleading graphs in media?
To increase the number of graphs in media
To make graphs more colorful
To create more complex graphs
To ensure accurate data interpretation
2.
MULTIPLE CHOICE QUESTION
30 sec • 1 pt
What is a common mistake in bar charts that can mislead viewers?
Using too many colors
Having bars of unequal widths
Labeling the bars with numbers
Using a horizontal layout
3.
MULTIPLE CHOICE QUESTION
30 sec • 1 pt
How can the spacing between bars in a bar chart be misleading?
By making the chart look more colorful
By making the chart appear more organized
By creating an illusion of equal frequency
By making the chart easier to read
4.
MULTIPLE CHOICE QUESTION
30 sec • 1 pt
What is a potential issue with the vertical axis in line graphs?
It can be too wide
It can be too short
It can be too colorful
It can start at a non-zero point
5.
MULTIPLE CHOICE QUESTION
30 sec • 1 pt
Why might a line graph appear to show a larger change than actually exists?
Due to a non-zero starting point on the vertical axis
Due to a lack of data points
Because of a missing title
Because of a colorful background
6.
MULTIPLE CHOICE QUESTION
30 sec • 1 pt
What is a misleading feature of 3D pie charts?
They are difficult to draw
They make front sectors appear larger
They make all sectors look the same size
They use too many colors
7.
MULTIPLE CHOICE QUESTION
30 sec • 1 pt
How can a pie chart be misleading if angles are calculated incorrectly?
It can make the chart more symmetrical
It can make the chart easier to read
It can make sectors appear larger or smaller than they are
It can make the chart look more colorful
Access all questions and much more by creating a free account
Create resources
Host any resource
Get auto-graded reports
Continue with Google

Continue with Email
Continue with Classlink
Continue with Clever
or continue with
Microsoft
%20(1).png)
Apple
Others
Already have an account?
Popular Resources on Wayground

7 questions
History of Valentine's Day
Interactive video
•
4th Grade
15 questions
Fractions on a Number Line
Quiz
•
3rd Grade
20 questions
Equivalent Fractions
Quiz
•
3rd Grade
25 questions
Multiplication Facts
Quiz
•
5th Grade
22 questions
fractions
Quiz
•
3rd Grade
15 questions
Valentine's Day Trivia
Quiz
•
3rd Grade
20 questions
Main Idea and Details
Quiz
•
5th Grade
20 questions
Context Clues
Quiz
•
6th Grade
Discover more resources for Mathematics
14 questions
Volume of rectangular prisms
Quiz
•
7th Grade
20 questions
Laws of Exponents
Quiz
•
8th Grade
20 questions
Graphing Inequalities on a Number Line
Quiz
•
6th - 9th Grade
20 questions
Exponent Properties
Quiz
•
9th Grade
16 questions
2022 Winter Olympics Medal Table
Passage
•
6th - 8th Grade
20 questions
Complementary Supplementary Vertical Adjacent Angles
Quiz
•
8th Grade
12 questions
Add, Subtract, Multiply and divide integers
Quiz
•
7th Grade
20 questions
One Step equations addition and subtraction
Quiz
•
5th - 8th Grade