Understanding Graphs and Line Plots
Interactive Video
•
Mathematics, Education, Social Studies
•
3rd - 5th Grade
•
Practice Problem
•
Medium

Lucas Foster
Used 52+ times
FREE Resource
Read more
10 questions
Show all answers
1.
MULTIPLE CHOICE QUESTION
30 sec • 1 pt
What is the purpose of a title in a bar graph?
To make the graph look attractive
To provide a snapshot of the graph's topic
To confuse the viewer
To add more data to the graph
2.
MULTIPLE CHOICE QUESTION
30 sec • 1 pt
In a pictograph, what does the key help us determine?
The value of each picture
The scale of the graph
The title of the graph
The color of the graph
3.
MULTIPLE CHOICE QUESTION
30 sec • 1 pt
How is data represented in a line plot?
Using bars
Using pictures
Using X's or dots
Using numbers
4.
MULTIPLE CHOICE QUESTION
30 sec • 1 pt
Which pet received the most votes in the line plot example?
Cat
Dog
Bunny
Turtle
5.
MULTIPLE CHOICE QUESTION
30 sec • 1 pt
How many total votes were recorded in the pets line plot?
10
14
12
16
6.
MULTIPLE CHOICE QUESTION
30 sec • 1 pt
Which two pets combined have a total of five votes?
Cat and Turtle
Dog and Bunny
Bunny and Turtle
Dog and Cat
7.
MULTIPLE CHOICE QUESTION
30 sec • 1 pt
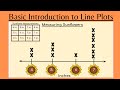
In the sunflower line plot, which measurement was recorded the most?
7 inches
6 inches
4 inches
5 inches
Access all questions and much more by creating a free account
Create resources
Host any resource
Get auto-graded reports
Continue with Google

Continue with Email
Continue with Classlink
Continue with Clever
or continue with
Microsoft
%20(1).png)
Apple
Others
Already have an account?
