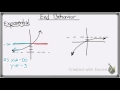
Understanding Exponential Graphs
Interactive Video
•
Mathematics
•
9th - 12th Grade
•
Practice Problem
•
Hard
Standards-aligned

Jackson Turner
FREE Resource
Standards-aligned
Read more
10 questions
Show all answers
1.
MULTIPLE CHOICE QUESTION
30 sec • 1 pt
What is the primary focus when analyzing exponential graphs?
The size of the graph
The type of graph paper used
The relationship between X and Y values
The color of the graph
Tags
CCSS.HSF-IF.C.7E
2.
MULTIPLE CHOICE QUESTION
30 sec • 1 pt
As X approaches negative infinity on the left side of the graph, what happens to the Y values?
They approach zero
They approach the asymptote
They become undefined
They remain constant
Tags
CCSS.HSF-IF.C.7E
3.
MULTIPLE CHOICE QUESTION
30 sec • 1 pt
What is the significance of the asymptote in analyzing exponential graphs?
It shows the value Y approaches as X goes to infinity
It indicates the maximum value of Y
It determines the color of the graph
It is irrelevant to the graph
Tags
CCSS.HSF-IF.C.7D
4.
MULTIPLE CHOICE QUESTION
30 sec • 1 pt
In the first example, what is the Y value of the asymptote on the left side?
1
3
0
2
Tags
CCSS.HSF-IF.C.7E
5.
MULTIPLE CHOICE QUESTION
30 sec • 1 pt
What is the behavior of Y values as X approaches positive infinity on the right side of the graph?
Y values decrease
Y values approach zero
Y values remain constant
Y values increase towards positive infinity
Tags
CCSS.HSF-IF.C.7E
6.
MULTIPLE CHOICE QUESTION
30 sec • 1 pt
What does it mean when Y values are 'approaching' a number?
Y values are oscillating around that number
Y values are moving away from that number
Y values are getting closer to that number
Y values are exactly equal to that number
Tags
CCSS.HSF-IF.C.7E
7.
MULTIPLE CHOICE QUESTION
30 sec • 1 pt
In the second example, what happens to Y values as X approaches negative infinity on the left side?
Y values increase
Y values approach the asymptote
Y values remain constant
Y values decrease towards negative infinity
Tags
CCSS.HSF-IF.C.7E
Access all questions and much more by creating a free account
Create resources
Host any resource
Get auto-graded reports
Continue with Google

Continue with Email
Continue with Classlink
Continue with Clever
or continue with
Microsoft
%20(1).png)
Apple
Others
Already have an account?
Popular Resources on Wayground

15 questions
Fractions on a Number Line
Quiz
•
3rd Grade
20 questions
Equivalent Fractions
Quiz
•
3rd Grade
25 questions
Multiplication Facts
Quiz
•
5th Grade
22 questions
fractions
Quiz
•
3rd Grade
20 questions
Main Idea and Details
Quiz
•
5th Grade
20 questions
Context Clues
Quiz
•
6th Grade
15 questions
Equivalent Fractions
Quiz
•
4th Grade
20 questions
Figurative Language Review
Quiz
•
6th Grade
Discover more resources for Mathematics
20 questions
Graphing Inequalities on a Number Line
Quiz
•
6th - 9th Grade
12 questions
Exponential Growth and Decay
Quiz
•
9th Grade
20 questions
Exponent Rules Review
Quiz
•
8th - 9th Grade
25 questions
Complementary and Supplementary Angles
Quiz
•
7th - 10th Grade
12 questions
Add and Subtract Polynomials
Quiz
•
9th - 12th Grade
13 questions
Model Exponential Growth and Decay Scenarios
Quiz
•
9th - 12th Grade
15 questions
Combine Like Terms and Distributive Property
Quiz
•
8th - 9th Grade
27 questions
7.2.3 Quadrilateral Properties
Quiz
•
9th - 12th Grade