Understanding Line Plots and Data
Interactive Video
•
Mathematics, Science, Education
•
3rd - 5th Grade
•
Practice Problem
•
Hard

Emma Peterson
FREE Resource
Read more
10 questions
Show all answers
1.
MULTIPLE CHOICE QUESTION
30 sec • 1 pt
What does a line plot represent when data is shown on a number line?
A scatter plot
A pie chart
A line plot
A bar graph
2.
MULTIPLE CHOICE QUESTION
30 sec • 1 pt
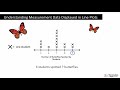
In the butterfly example, what does each 'X' on the line plot represent?
One butterfly
One garden
One student
One plant
3.
MULTIPLE CHOICE QUESTION
30 sec • 1 pt
How many students spotted five butterflies according to the line plot?
Four students
Five students
Three students
Two students
4.
MULTIPLE CHOICE QUESTION
30 sec • 1 pt
If four students spotted nine butterflies, how many 'X's should be above the number nine?
Five
Four
Three
Two
5.
MULTIPLE CHOICE QUESTION
30 sec • 1 pt
In the plant height example, what does each 'X' represent?
One inch
One plant
One garden
One student
6.
MULTIPLE CHOICE QUESTION
30 sec • 1 pt
How many plants are 15 inches tall according to the line plot?
Five plants
Four plants
Six plants
Three plants
7.
MULTIPLE CHOICE QUESTION
30 sec • 1 pt
Which height is the most common among Jackie's plants?
14 inches
15 inches
16 inches
17 inches
Access all questions and much more by creating a free account
Create resources
Host any resource
Get auto-graded reports
Continue with Google

Continue with Email
Continue with Classlink
Continue with Clever
or continue with
Microsoft
%20(1).png)
Apple
Others
Already have an account?
Popular Resources on Wayground

15 questions
Fractions on a Number Line
Quiz
•
3rd Grade
20 questions
Equivalent Fractions
Quiz
•
3rd Grade
25 questions
Multiplication Facts
Quiz
•
5th Grade
29 questions
Alg. 1 Section 5.1 Coordinate Plane
Quiz
•
9th Grade
22 questions
fractions
Quiz
•
3rd Grade
11 questions
FOREST Effective communication
Lesson
•
KG
20 questions
Main Idea and Details
Quiz
•
5th Grade
20 questions
Context Clues
Quiz
•
6th Grade
Discover more resources for Mathematics
15 questions
Fractions on a Number Line
Quiz
•
3rd Grade
20 questions
Equivalent Fractions
Quiz
•
3rd Grade
25 questions
Multiplication Facts
Quiz
•
5th Grade
22 questions
fractions
Quiz
•
3rd Grade
15 questions
Equivalent Fractions
Quiz
•
4th Grade
18 questions
Comparing Fractions with same numerator or denominator
Quiz
•
3rd Grade
15 questions
Fractions on a number line
Quiz
•
3rd Grade
10 questions
Area
Quiz
•
3rd Grade