Understanding Relative Frequency Distribution
Interactive Video
•
Mathematics, Science
•
6th - 10th Grade
•
Practice Problem
•
Medium
+1
Standards-aligned

Mia Campbell
Used 1+ times
FREE Resource
Standards-aligned
Read more
10 questions
Show all answers
1.
MULTIPLE CHOICE QUESTION
30 sec • 1 pt
What is the first step in creating a relative frequency distribution table?
Create a cumulative frequency table
Determine the highest value
Calculate the total frequency
List the data set values
Tags
CCSS.6.SP.B.5A
2.
MULTIPLE CHOICE QUESTION
30 sec • 1 pt
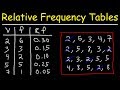
How many times does the number 2 appear in the data set?
4 times
5 times
6 times
7 times
Tags
CCSS.6.SP.B.5A
3.
MULTIPLE CHOICE QUESTION
30 sec • 1 pt
What is the frequency of the number 5 in the data set?
6
3
5
4
Tags
CCSS.8.SP.A.4
4.
MULTIPLE CHOICE QUESTION
30 sec • 1 pt
How do you calculate the relative frequency of a value?
Divide the value by the total number of values
Multiply the frequency by the total frequency
Divide the frequency by the total frequency
Subtract the frequency from the total frequency
Tags
CCSS.8.SP.A.4
5.
MULTIPLE CHOICE QUESTION
30 sec • 1 pt
What is the relative frequency of the number 4?
0.15
0.10
0.20
0.05
Tags
CCSS.8.SP.A.4
6.
MULTIPLE CHOICE QUESTION
30 sec • 1 pt
What should the sum of all relative frequencies equal?
0.5
1.0
2.0
1.5
Tags
CCSS.7.SP.A.2
7.
MULTIPLE CHOICE QUESTION
30 sec • 1 pt
Which value has a relative frequency of 0.25?
5
3
2
8
Access all questions and much more by creating a free account
Create resources
Host any resource
Get auto-graded reports
Continue with Google

Continue with Email
Continue with Classlink
Continue with Clever
or continue with
Microsoft
%20(1).png)
Apple
Others
Already have an account?
Popular Resources on Wayground

15 questions
Fractions on a Number Line
Quiz
•
3rd Grade
20 questions
Equivalent Fractions
Quiz
•
3rd Grade
25 questions
Multiplication Facts
Quiz
•
5th Grade
29 questions
Alg. 1 Section 5.1 Coordinate Plane
Quiz
•
9th Grade
22 questions
fractions
Quiz
•
3rd Grade
11 questions
FOREST Effective communication
Lesson
•
KG
20 questions
Main Idea and Details
Quiz
•
5th Grade
20 questions
Context Clues
Quiz
•
6th Grade
Discover more resources for Mathematics
29 questions
Alg. 1 Section 5.1 Coordinate Plane
Quiz
•
9th Grade
36 questions
6th Grade Math STAAR Review
Quiz
•
6th Grade
14 questions
Volume of rectangular prisms
Quiz
•
7th Grade
14 questions
finding slope from a graph
Quiz
•
8th Grade
20 questions
Graphing Inequalities on a Number Line
Quiz
•
6th - 9th Grade
23 questions
Solve and Graph Inequalities
Quiz
•
6th Grade
15 questions
Distributive Property & Review
Quiz
•
6th Grade
10 questions
Mean, Median, Mode, and Range
Quiz
•
7th Grade