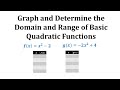
Quadratic Functions and Their Graphs
Interactive Video
•
Mathematics
•
7th - 10th Grade
•
Practice Problem
•
Hard
Standards-aligned

Sophia Harris
FREE Resource
Standards-aligned
Read more
10 questions
Show all answers
1.
MULTIPLE CHOICE QUESTION
30 sec • 1 pt
What is the parent function of f(x) = x^2 - 2?
f(x) = x^2
f(x) = x^2 + 2
f(x) = x^2 - 4
f(x) = x^2 + 4
Tags
CCSS.HSF.IF.A.2
2.
MULTIPLE CHOICE QUESTION
30 sec • 1 pt
What is the value of f(1) for the function f(x) = x^2 - 2?
0
-2
1
-1
Tags
CCSS.HSF.IF.A.1
3.
MULTIPLE CHOICE QUESTION
30 sec • 1 pt
Which of the following points is on the graph of f(x) = x^2 - 2?
(0, 0)
(2, 0)
(0, -2)
(1, 1)
4.
MULTIPLE CHOICE QUESTION
30 sec • 1 pt
What is the domain of the function f(x) = x^2 - 2?
x > 0
All real numbers
x ≤ 0
x ≥ 0
5.
MULTIPLE CHOICE QUESTION
30 sec • 1 pt
What is the range of the function f(x) = x^2 - 2?
y ≥ -2
y ≤ -2
y < -2
y > -2
6.
MULTIPLE CHOICE QUESTION
30 sec • 1 pt
What is the vertex of the function g(x) = -2x^2 + 4?
(-2, 0)
(2, 0)
(0, -4)
(0, 4)
Tags
CCSS.HSF.IF.A.2
7.
MULTIPLE CHOICE QUESTION
30 sec • 1 pt
What is the value of g(2) for the function g(x) = -2x^2 + 4?
2
4
0
-4
Tags
CCSS.HSF.IF.A.1
Access all questions and much more by creating a free account
Create resources
Host any resource
Get auto-graded reports
Continue with Google

Continue with Email
Continue with Classlink
Continue with Clever
or continue with
Microsoft
%20(1).png)
Apple
Others
Already have an account?
