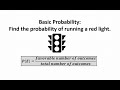
Probability and Statistics of Running Red Lights
Interactive Video
•
Mathematics
•
7th - 10th Grade
•
Practice Problem
•
Hard
+1
Standards-aligned

Ethan Morris
FREE Resource
Standards-aligned
Read more
7 questions
Show all answers
1.
MULTIPLE CHOICE QUESTION
30 sec • 1 pt
What is the main question being addressed in the video?
What is the percentage of people who did not run a red light?
How to calculate the total number of respondents?
What is the probability of a randomly chosen person having run a red light last year?
How many people ran a red light last year?
Tags
CCSS.3.MD.B.3
2.
MULTIPLE CHOICE QUESTION
30 sec • 1 pt
How many people responded 'Yes' to running a red light?
107
640
214
426
Tags
CCSS.6.SP.B.5A
3.
MULTIPLE CHOICE QUESTION
30 sec • 1 pt
What is the total number of respondents in the survey?
640
426
214
107
Tags
CCSS.7.SP.C.7B
4.
MULTIPLE CHOICE QUESTION
30 sec • 1 pt
What is the simplified fraction representing the probability of running a red light?
320/107
426/640
107/320
214/640
5.
MULTIPLE CHOICE QUESTION
30 sec • 1 pt
What is the decimal representation of the probability, rounded to four decimal places?
0.3344
0.2140
0.4260
0.1070
6.
MULTIPLE CHOICE QUESTION
30 sec • 1 pt
How do you convert a decimal to a percentage?
Divide by 100 and add a percent sign
Multiply by 100 and add a percent sign
Add 100 and add a percent sign
Subtract 100 and add a percent sign
Tags
CCSS.7.SP.C.5
7.
MULTIPLE CHOICE QUESTION
30 sec • 1 pt
What is the percentage probability of a person having run a red light?
10.70%
33.44%
42.60%
21.40%
Tags
CCSS.7.SP.C.5
Access all questions and much more by creating a free account
Create resources
Host any resource
Get auto-graded reports
Continue with Google

Continue with Email
Continue with Microsoft
or continue with

%20(1).png)
Apple
Others
Already have an account?
