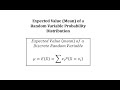
Understanding Probability Distribution and Expected Value
Interactive Video
•
Mathematics
•
7th - 10th Grade
•
Practice Problem
•
Hard
+1
Standards-aligned

Mia Campbell
FREE Resource
Standards-aligned
Read more
10 questions
Show all answers
1.
MULTIPLE CHOICE QUESTION
30 sec • 1 pt
What is the total number of checkout stations in the grocery store?
Six
Four
Seven
Five
Tags
CCSS.HSS.MD.A.2
2.
MULTIPLE CHOICE QUESTION
30 sec • 1 pt
In the table, what does the first row represent?
Sum of products
Expected value
Number of utilized stations
Probabilities
Tags
CCSS.HSS.MD.B.6
CCSS.HSS.MD.B.7
3.
MULTIPLE CHOICE QUESTION
30 sec • 1 pt
What is the probability that exactly two stations are utilized?
0.10
0.18
0.39
0.17
Tags
CCSS.HSS.MD.A.2
4.
MULTIPLE CHOICE QUESTION
30 sec • 1 pt
How do you calculate the expected value in this context?
By dividing the total number of stations by the sum of probabilities
By subtracting the smallest probability from the largest
By multiplying each station number by its probability and summing the results
By adding all probabilities
5.
MULTIPLE CHOICE QUESTION
30 sec • 1 pt
What is the product of 3 utilized stations and its probability?
0.68
0.36
0.24
1.17
Tags
CCSS.6.SP.B.5C
6.
MULTIPLE CHOICE QUESTION
30 sec • 1 pt
What is the sum of the products of the number of utilized stations and their probabilities?
4.15
3.15
5.15
2.15
Tags
CCSS.HSS.MD.A.2
7.
MULTIPLE CHOICE QUESTION
30 sec • 1 pt
What does the expected value represent in this scenario?
The average number of utilized stations
The most probable number of utilized stations
The minimum number of utilized stations
The maximum number of utilized stations
Tags
CCSS.HSS.MD.A.2
Access all questions and much more by creating a free account
Create resources
Host any resource
Get auto-graded reports
Continue with Google

Continue with Email
Continue with Classlink
Continue with Clever
or continue with
Microsoft
%20(1).png)
Apple
Others
Already have an account?
Popular Resources on Wayground

7 questions
History of Valentine's Day
Interactive video
•
4th Grade
15 questions
Fractions on a Number Line
Quiz
•
3rd Grade
20 questions
Equivalent Fractions
Quiz
•
3rd Grade
25 questions
Multiplication Facts
Quiz
•
5th Grade
22 questions
fractions
Quiz
•
3rd Grade
15 questions
Valentine's Day Trivia
Quiz
•
3rd Grade
20 questions
Main Idea and Details
Quiz
•
5th Grade
20 questions
Context Clues
Quiz
•
6th Grade
Discover more resources for Mathematics
14 questions
Volume of rectangular prisms
Quiz
•
7th Grade
20 questions
Laws of Exponents
Quiz
•
8th Grade
20 questions
Graphing Inequalities on a Number Line
Quiz
•
6th - 9th Grade
20 questions
Exponent Properties
Quiz
•
9th Grade
16 questions
2022 Winter Olympics Medal Table
Passage
•
6th - 8th Grade
20 questions
Complementary Supplementary Vertical Adjacent Angles
Quiz
•
8th Grade
12 questions
Add, Subtract, Multiply and divide integers
Quiz
•
7th Grade
20 questions
One Step equations addition and subtraction
Quiz
•
5th - 8th Grade