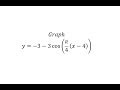
Graphing Cosine Functions and Properties
Interactive Video
•
Mathematics
•
9th - 12th Grade
•
Practice Problem
•
Hard
Standards-aligned

Lucas Foster
FREE Resource
Standards-aligned
Read more
10 questions
Show all answers
1.
MULTIPLE CHOICE QUESTION
30 sec • 1 pt
What is the coefficient of the cosine function in the given equation?
-4
4
-3
3
Tags
CCSS.HSF.TF.A.4
2.
MULTIPLE CHOICE QUESTION
30 sec • 1 pt
How is the period of the function calculated?
By dividing 2π by b
By multiplying b by 2π
By subtracting b from 2π
By adding b to 2π
Tags
CCSS.HSF-IF.C.7E
3.
MULTIPLE CHOICE QUESTION
30 sec • 1 pt
What is the phase shift of the function?
Left 4 units
Right 4 units
Up 4 units
Down 4 units
4.
MULTIPLE CHOICE QUESTION
30 sec • 1 pt
What is the vertical shift of the function?
Up 3 units
Up 6 units
Down 3 units
Down 6 units
Tags
CCSS.HSF-IF.C.7E
5.
MULTIPLE CHOICE QUESTION
30 sec • 1 pt
What is the midline of the function?
y = -6
y = 3
y = 0
y = -3
Tags
CCSS.HSF-IF.C.7E
6.
MULTIPLE CHOICE QUESTION
30 sec • 1 pt
Where does the graph of the function start after the phase shift?
x = 4
x = 0
x = -4
x = 8
Tags
CCSS.HSF-IF.C.7E
7.
MULTIPLE CHOICE QUESTION
30 sec • 1 pt
What is the pattern used to graph the cosine function over one period?
Midline, Maximum, Midline, Minimum, Midline
Maximum, Minimum, Midline, Maximum, Minimum
Maximum, Midline, Minimum, Midline, Maximum
Minimum, Midline, Maximum, Midline, Minimum
Tags
CCSS.HSF-IF.C.7A
Access all questions and much more by creating a free account
Create resources
Host any resource
Get auto-graded reports
Continue with Google

Continue with Email
Continue with Classlink
Continue with Clever
or continue with
Microsoft
%20(1).png)
Apple
Others
Already have an account?
Popular Resources on Wayground

15 questions
Fractions on a Number Line
Quiz
•
3rd Grade
20 questions
Equivalent Fractions
Quiz
•
3rd Grade
25 questions
Multiplication Facts
Quiz
•
5th Grade
29 questions
Alg. 1 Section 5.1 Coordinate Plane
Quiz
•
9th Grade
22 questions
fractions
Quiz
•
3rd Grade
11 questions
FOREST Effective communication
Lesson
•
KG
20 questions
Main Idea and Details
Quiz
•
5th Grade
20 questions
Context Clues
Quiz
•
6th Grade
Discover more resources for Mathematics
29 questions
Alg. 1 Section 5.1 Coordinate Plane
Quiz
•
9th Grade
20 questions
Graphing Inequalities on a Number Line
Quiz
•
6th - 9th Grade
20 questions
Box and Whisker Plots
Quiz
•
9th Grade
18 questions
Exponential Growth and Decay
Quiz
•
9th Grade
20 questions
Function or Not a Function
Quiz
•
8th - 9th Grade
20 questions
SSS/SAS
Quiz
•
9th - 12th Grade
14 questions
Making Inferences From Samples
Quiz
•
7th - 12th Grade
23 questions
CCG - CH8 Polygon angles and area Review
Quiz
•
9th - 12th Grade