Understanding Quadratic Functions and Unemployment Rates
Interactive Video
•
Mathematics
•
10th - 12th Grade
•
Practice Problem
•
Hard
Standards-aligned

Jackson Turner
FREE Resource
Standards-aligned
Read more
10 questions
Show all answers
1.
MULTIPLE CHOICE QUESTION
30 sec • 1 pt
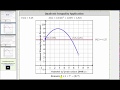
What does the quadratic function u(t) represent in the context of the Phoenix-Mesa-Scottsdale area?
The annual GDP growth rate
The annual unemployment percentage rate
The annual population growth rate
The annual inflation rate
2.
MULTIPLE CHOICE QUESTION
30 sec • 1 pt
What is the domain of the quadratic function u(t) in terms of t?
t is between 0 and 7, including both 0 and 7
t is greater than 7
t is less than 0
t is between 0 and 7, including 0 but not 7
3.
MULTIPLE CHOICE QUESTION
30 sec • 1 pt
How do you determine when the unemployment rate was greater than 6.25% using a graph?
By finding when the graph is parallel to the horizontal line
By finding when the graph intersects the horizontal line
By finding when the graph is above the horizontal line
By finding when the graph is below the horizontal line
4.
MULTIPLE CHOICE QUESTION
30 sec • 1 pt
In interval notation, how is the period when the unemployment rate was above 6.25% expressed?
(0, 5.5)
[0, 5.5]
(0, 5.5]
[0, 5.5)
Tags
CCSS.8.EE.C.8C
5.
MULTIPLE CHOICE QUESTION
30 sec • 1 pt
What tool is used to find the intersection points on the graph for the unemployment rate analysis?
Excel spreadsheet
TI-84 calculator
Graphing paper
Scientific calculator
6.
MULTIPLE CHOICE QUESTION
30 sec • 1 pt
During which years was the unemployment rate above 6.25%?
2008 to 2013
2009 to 2014
2008 to 2012
2009 to 2013
7.
MULTIPLE CHOICE QUESTION
30 sec • 1 pt
When analyzing the unemployment rate being less than 8.25%, what is the significance of the intersection points?
They determine the minimum rate
They are included in the interval
They are excluded from the interval
They determine the maximum rate
Access all questions and much more by creating a free account
Create resources
Host any resource
Get auto-graded reports
Continue with Google

Continue with Email
Continue with Classlink
Continue with Clever
or continue with
Microsoft
%20(1).png)
Apple
Others
Already have an account?
