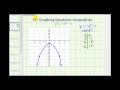
Graphing Quadratic Inequalities
Interactive Video
•
Mathematics
•
9th - 12th Grade
•
Practice Problem
•
Medium
Standards-aligned

Emma Peterson
Used 1+ times
FREE Resource
Standards-aligned
Read more
10 questions
Show all answers
1.
MULTIPLE CHOICE QUESTION
30 sec • 1 pt
What is the first step in graphing the solution to the inequality y ≤ -x² - 1?
Shade the region above the parabola
Graph y = -x² - 1
Find the x-intercepts
Determine the vertex of the parabola
Tags
CCSS.HSF-IF.C.7A
2.
MULTIPLE CHOICE QUESTION
30 sec • 1 pt
Why is the graph of y = -x² - 1 solid?
Because it is a linear equation
Because y is greater than -x² - 1
Because y is less than or equal to -x² - 1
Because it is a dashed line
3.
MULTIPLE CHOICE QUESTION
30 sec • 1 pt
How is the graph of y = -x² - 1 related to y = x²?
It is stretched vertically
It is shifted up one unit
It is reflected over the y-axis
It is reflected over the x-axis and shifted down one unit
Tags
CCSS.HSF.IF.A.2
4.
MULTIPLE CHOICE QUESTION
30 sec • 1 pt
What is the y-coordinate when x = 0 for the equation y = -x² - 1?
-2
1
0
-1
Tags
CCSS.HSF-IF.C.7A
5.
MULTIPLE CHOICE QUESTION
30 sec • 1 pt
Which points are used to graph the parabola y = -x² - 1?
(0,-1), (2,-5), (-2,-5)
(0,0), (1,-1), (-1,-1)
(0,-1), (1,-2), (-1,-2)
(0,1), (2,3), (-2,3)
Tags
CCSS.HSA.REI.D.12
6.
MULTIPLE CHOICE QUESTION
30 sec • 1 pt
What is the purpose of selecting a test point when graphing inequalities?
To find the vertex of the parabola
To calculate the x-intercepts
To determine the slope of the line
To check which region satisfies the inequality
Tags
CCSS.HSA.REI.D.12
7.
MULTIPLE CHOICE QUESTION
30 sec • 1 pt
Which test point is commonly used to determine the shading region?
(1,1)
(0,0)
(-1,-1)
(2,2)
Tags
CCSS.HSA.REI.D.12
Access all questions and much more by creating a free account
Create resources
Host any resource
Get auto-graded reports
Continue with Google

Continue with Email
Continue with Classlink
Continue with Clever
or continue with
Microsoft
%20(1).png)
Apple
Others
Already have an account?
Popular Resources on Wayground

7 questions
History of Valentine's Day
Interactive video
•
4th Grade
15 questions
Fractions on a Number Line
Quiz
•
3rd Grade
20 questions
Equivalent Fractions
Quiz
•
3rd Grade
25 questions
Multiplication Facts
Quiz
•
5th Grade
22 questions
fractions
Quiz
•
3rd Grade
15 questions
Valentine's Day Trivia
Quiz
•
3rd Grade
20 questions
Main Idea and Details
Quiz
•
5th Grade
20 questions
Context Clues
Quiz
•
6th Grade
Discover more resources for Mathematics
20 questions
Graphing Inequalities on a Number Line
Quiz
•
6th - 9th Grade
20 questions
Exponent Properties
Quiz
•
9th Grade
15 questions
Combine Like Terms and Distributive Property
Quiz
•
8th - 9th Grade
20 questions
Function or Not a Function
Quiz
•
8th - 9th Grade
10 questions
Factor Quadratic Expressions with Various Coefficients
Quiz
•
9th - 12th Grade
10 questions
Elijah McCoy: Innovations and Impact in Black History
Interactive video
•
6th - 10th Grade
10 questions
Evaluating Piecewise Functions Practice
Quiz
•
11th Grade
21 questions
Factoring Trinomials (a=1)
Quiz
•
9th Grade