Understanding Sine Function Transformations
Interactive Video
•
Mathematics
•
9th - 12th Grade
•
Practice Problem
•
Hard
Standards-aligned

Ethan Morris
FREE Resource
Standards-aligned
Read more
10 questions
Show all answers
1.
MULTIPLE CHOICE QUESTION
30 sec • 1 pt
What does the absolute value of 'a' represent in the sine function transformation?
The vertical shift of the function
The phase shift of the function
The amplitude of the function
The period of the function
Tags
CCSS.HSF-IF.C.7E
2.
MULTIPLE CHOICE QUESTION
30 sec • 1 pt
If 'a' is negative, what happens to the graph of the sine function?
It shifts horizontally
It reflects across the midline
It shifts vertically
It remains unchanged
3.
MULTIPLE CHOICE QUESTION
30 sec • 1 pt
In the example function, what is the first step to handle a negative 'b' value?
Add a constant to the function
Factor out a negative from the equation
Ignore the negative sign
Multiply the function by a constant
Tags
CCSS.HSF-IF.C.7E
4.
MULTIPLE CHOICE QUESTION
30 sec • 1 pt
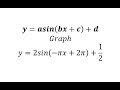
What is the period of the function y = 2sin(-πx + 2π) + 0.5 after transformation?
2 units
1 unit
4 units
π units
Tags
CCSS.HSF-IF.C.7E
5.
MULTIPLE CHOICE QUESTION
30 sec • 1 pt
How is the phase shift determined in the transformed sine function?
By the value of 'b' divided by 'c'
By the value of 'd'
By the value of 'a'
By the value of 'c' divided by 'b'
Tags
CCSS.HSF-IF.C.7E
6.
MULTIPLE CHOICE QUESTION
30 sec • 1 pt
What is the vertical shift in the function y = 2sin(πx - 2π) + 0.5?
Down 1 unit
Up 0.5 units
Down 0.5 units
Up 1 unit
Tags
CCSS.HSF-IF.C.7E
7.
MULTIPLE CHOICE QUESTION
30 sec • 1 pt
Where does the midline of the graph lie after the vertical shift?
y = 0
y = 1
y = 0.5
y = -0.5
Tags
CCSS.HSF-IF.C.7E
Access all questions and much more by creating a free account
Create resources
Host any resource
Get auto-graded reports
Continue with Google

Continue with Email
Continue with Classlink
Continue with Clever
or continue with
Microsoft
%20(1).png)
Apple
Others
Already have an account?
Popular Resources on Wayground

15 questions
Fractions on a Number Line
Quiz
•
3rd Grade
20 questions
Equivalent Fractions
Quiz
•
3rd Grade
25 questions
Multiplication Facts
Quiz
•
5th Grade
54 questions
Analyzing Line Graphs & Tables
Quiz
•
4th Grade
22 questions
fractions
Quiz
•
3rd Grade
20 questions
Main Idea and Details
Quiz
•
5th Grade
20 questions
Context Clues
Quiz
•
6th Grade
15 questions
Equivalent Fractions
Quiz
•
4th Grade
Discover more resources for Mathematics
20 questions
Graphing Inequalities on a Number Line
Quiz
•
6th - 9th Grade
18 questions
SAT Prep: Ratios, Proportions, & Percents
Quiz
•
9th - 10th Grade
12 questions
Exponential Growth and Decay
Quiz
•
9th Grade
12 questions
Parallel Lines Cut by a Transversal
Quiz
•
10th Grade
12 questions
Add and Subtract Polynomials
Quiz
•
9th - 12th Grade
15 questions
Combine Like Terms and Distributive Property
Quiz
•
8th - 9th Grade
20 questions
Function or Not a Function
Quiz
•
8th - 9th Grade
10 questions
Elijah McCoy: Innovations and Impact in Black History
Interactive video
•
6th - 10th Grade