Understanding Percent Problems with Bar Diagrams
Interactive Video
•
Mathematics, English, Science, Education
•
4th - 8th Grade
•
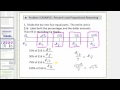
Practice Problem
•
Hard
+2
Standards-aligned

Jackson Turner
FREE Resource
Standards-aligned
Read more
10 questions
Show all answers
1.
MULTIPLE CHOICE QUESTION
30 sec • 1 pt
What is the purpose of using a bar diagram in solving percent problems?
To avoid using mathematical formulas
To make the problem more complex
To calculate the exact value of percentages
To visualize the relationship between parts and the whole
Tags
CCSS.6.NS.B.3
2.
MULTIPLE CHOICE QUESTION
30 sec • 1 pt
In the first example, what does each part of the bar represent in dollars?
$16
$8
$4
$2
3.
MULTIPLE CHOICE QUESTION
30 sec • 1 pt
How is the percentage labeled on the bar diagram in the first example?
By dividing 100% by 4
By dividing 100% by 16
By dividing 100% by 8
By dividing 100% by 2
Tags
CCSS.6.RP.A.3C
4.
MULTIPLE CHOICE QUESTION
30 sec • 1 pt
What is 50% of $16 according to the bar diagram?
$8
$12
$4
$16
Tags
CCSS.3.NF.A.1
CCSS.3.NF.A.2B
5.
MULTIPLE CHOICE QUESTION
30 sec • 1 pt
In the second example, how many equal parts is the bar divided into?
12
8
5
10
Tags
CCSS.3.NF.A.1
CCSS.3.NF.A.2B
6.
MULTIPLE CHOICE QUESTION
30 sec • 1 pt
What is the dollar value of each part in the second example?
$5
$2
$10
$15
7.
MULTIPLE CHOICE QUESTION
30 sec • 1 pt
How is the percentage labeled on the bar diagram in the second example?
By dividing 100% by 5
By dividing 100% by 20
By dividing 100% by 10
By dividing 100% by 15
Tags
CCSS.6.RP.A.3C
Access all questions and much more by creating a free account
Create resources
Host any resource
Get auto-graded reports
Continue with Google

Continue with Email
Continue with Classlink
Continue with Clever
or continue with
Microsoft
%20(1).png)
Apple
Others
Already have an account?
