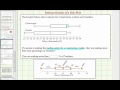
Understanding Box Plots and Salary Comparisons
Interactive Video
•
Mathematics, Education
•
7th - 10th Grade
•
Practice Problem
•
Hard

Sophia Harris
FREE Resource
Read more
7 questions
Show all answers
1.
MULTIPLE CHOICE QUESTION
30 sec • 1 pt
What does the horizontal axis represent in the box plots for construction workers and teachers?
Percentage of total salaries
Number of employees
Thousands of dollars
Years of experience
2.
MULTIPLE CHOICE QUESTION
30 sec • 1 pt
Which of the following is NOT part of the five-number summary used in box plots?
Third Quartile
Minimum
Mean
Median
3.
MULTIPLE CHOICE QUESTION
30 sec • 1 pt
How is the data divided in a box plot using the five-number summary?
Into two equal groups
Into three equal groups
Into five equal groups
Into four equal groups
4.
MULTIPLE CHOICE QUESTION
30 sec • 1 pt
If a construction worker earns the median salary, they earn more than what percentage of teachers?
75%
100%
50%
25%
5.
MULTIPLE CHOICE QUESTION
30 sec • 1 pt
What is the median salary for construction workers as mentioned in the video?
$35,000
$30,000
$40,000
$25,000
6.
MULTIPLE CHOICE QUESTION
30 sec • 1 pt
In the context of the video, what does the third quartile represent for teachers?
The salary above which 25% of teachers earn
The salary below which 75% of teachers earn
The median salary
The highest salary
7.
MULTIPLE CHOICE QUESTION
30 sec • 1 pt
What conclusion can be drawn about the median salary of construction workers compared to teachers?
It is less than 25% of teachers' salaries
It is equal to the average salary of teachers
It is more than 75% of teachers' salaries
It is less than 50% of teachers' salaries
Access all questions and much more by creating a free account
Create resources
Host any resource
Get auto-graded reports
Continue with Google

Continue with Email
Continue with Classlink
Continue with Clever
or continue with
Microsoft
%20(1).png)
Apple
Others
Already have an account?
