Understanding Preference Tables and Voting Analysis
Interactive Video
•
Mathematics, Social Studies
•
6th - 8th Grade
•
Practice Problem
•
Hard

Amelia Wright
FREE Resource
Read more
10 questions
Show all answers
1.
MULTIPLE CHOICE QUESTION
30 sec • 1 pt
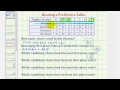
What information does the first row of the preference table provide?
The number of candidates
The number of voters
The candidates' names
The election date
2.
MULTIPLE CHOICE QUESTION
30 sec • 1 pt
How many candidates are involved in the election?
Three
Four
Two
Five
3.
MULTIPLE CHOICE QUESTION
30 sec • 1 pt
What is the total number of voters in the election?
65
61
55
50
4.
MULTIPLE CHOICE QUESTION
30 sec • 1 pt
How many first-place votes are required for a candidate to achieve a majority?
33
32
31
30
5.
MULTIPLE CHOICE QUESTION
30 sec • 1 pt
Which candidate received the highest number of first-place votes?
Candidate G
Candidate D
Candidate A
Candidate F
6.
MULTIPLE CHOICE QUESTION
30 sec • 1 pt
Which candidate received the fewest first-place votes?
Candidate D
Candidate A
Candidate F
Candidate G
7.
MULTIPLE CHOICE QUESTION
30 sec • 1 pt
What is the total number of first-place votes received by Candidate F?
3
9
5
7
Access all questions and much more by creating a free account
Create resources
Host any resource
Get auto-graded reports
Continue with Google

Continue with Email
Continue with Classlink
Continue with Clever
or continue with
Microsoft
%20(1).png)
Apple
Others
Already have an account?
Popular Resources on Wayground

7 questions
History of Valentine's Day
Interactive video
•
4th Grade
15 questions
Fractions on a Number Line
Quiz
•
3rd Grade
20 questions
Equivalent Fractions
Quiz
•
3rd Grade
25 questions
Multiplication Facts
Quiz
•
5th Grade
22 questions
fractions
Quiz
•
3rd Grade
15 questions
Valentine's Day Trivia
Quiz
•
3rd Grade
20 questions
Main Idea and Details
Quiz
•
5th Grade
20 questions
Context Clues
Quiz
•
6th Grade
Discover more resources for Mathematics
20 questions
Writing Algebraic Expressions
Quiz
•
6th Grade
20 questions
Ratios/Rates and Unit Rates
Quiz
•
6th Grade
14 questions
Volume of rectangular prisms
Quiz
•
7th Grade
20 questions
Laws of Exponents
Quiz
•
8th Grade
20 questions
Graphing Inequalities on a Number Line
Quiz
•
6th - 9th Grade
20 questions
One Step Equations
Quiz
•
6th Grade
10 questions
Solving One Step Inequalities
Quiz
•
6th Grade
15 questions
Equivalent Ratios
Quiz
•
6th Grade