Understanding Line Plots and Bar Graphs
Interactive Video
•
Mathematics, Education
•
3rd - 5th Grade
•
Practice Problem
•
Medium

Sophia Harris
Used 1+ times
FREE Resource
Read more
6 questions
Show all answers
1.
MULTIPLE CHOICE QUESTION
30 sec • 1 pt
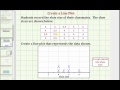
What is the total number of shoe sizes recorded by the students?
25
10
15
20
2.
MULTIPLE CHOICE QUESTION
30 sec • 1 pt
What does each 'x' represent on the line plot?
A pair of shoes
A shoe size
A student
A row of data
3.
MULTIPLE CHOICE QUESTION
30 sec • 1 pt
Where would you place an 'x' for a shoe size of 4.5?
Directly above 4
Directly above 5
Halfway between 4 and 5
Between 5 and 6
4.
MULTIPLE CHOICE QUESTION
30 sec • 1 pt
How do you handle repeated shoe sizes on the line plot?
Place them side by side
Stack them vertically
Ignore them
Use different colors
5.
MULTIPLE CHOICE QUESTION
30 sec • 1 pt
What is the next step after completing the line plot?
Create a pie chart
Create a bar graph
Create a scatter plot
Create a histogram
6.
MULTIPLE CHOICE QUESTION
30 sec • 1 pt
What does the height of the 'x's on the line plot represent in a bar graph?
Height of the bars
Color of the bars
Spacing of the bars
Width of the bars
Access all questions and much more by creating a free account
Create resources
Host any resource
Get auto-graded reports
Continue with Google

Continue with Email
Continue with Classlink
Continue with Clever
or continue with
Microsoft
%20(1).png)
Apple
Others
Already have an account?
