TI-84 One-Variable Statistics Concepts
Interactive Video
•
Mathematics, Science, Education
•
9th - 12th Grade
•
Practice Problem
•
Hard

Mia Campbell
FREE Resource
Read more
10 questions
Show all answers
1.
MULTIPLE CHOICE QUESTION
30 sec • 1 pt
What does 'X bar' represent in the one variable statistics tool on the TI-84?
The mean or average
The sum of the data values
The population standard deviation
The sample standard deviation
2.
MULTIPLE CHOICE QUESTION
30 sec • 1 pt
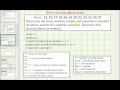
Which formula does the TI-84 use to calculate the position of the lower quartile (Q1)?
0.75 times the quantity n, plus one
2.25 times the quantity n, plus one
0.5 times the quantity n, plus one
1.5 times the quantity n, plus one
3.
MULTIPLE CHOICE QUESTION
30 sec • 1 pt
How does the TI-84 handle the median when calculating quartiles with an even number of data values?
It includes the median in both halves
It excludes the median from both halves
It includes the median in the lower half only
It includes the median in the upper half only
4.
MULTIPLE CHOICE QUESTION
30 sec • 1 pt
How does the TI-84 handle the median when calculating quartiles with an odd number of data values?
Includes the median in the upper half only
Includes the median in both halves
Excludes the median from both halves
Includes the median in the lower half only
5.
MULTIPLE CHOICE QUESTION
30 sec • 1 pt
When entering data into the TI-84, which list is used by default?
L2
L4
L3
L1
6.
MULTIPLE CHOICE QUESTION
30 sec • 1 pt
What is the first step in calculating one-variable statistics on the TI-84?
Enter the data in L1
Select the frequency list
Calculate the sum of squares
Press the graph key
7.
MULTIPLE CHOICE QUESTION
30 sec • 1 pt
What is the mean of the data set if the TI-84 shows X bar as 25.5?
27.5
26.5
25.5
24.5
Access all questions and much more by creating a free account
Create resources
Host any resource
Get auto-graded reports
Continue with Google

Continue with Email
Continue with Classlink
Continue with Clever
or continue with
Microsoft
%20(1).png)
Apple
Others
Already have an account?
Popular Resources on Wayground

15 questions
Fractions on a Number Line
Quiz
•
3rd Grade
20 questions
Equivalent Fractions
Quiz
•
3rd Grade
25 questions
Multiplication Facts
Quiz
•
5th Grade
54 questions
Analyzing Line Graphs & Tables
Quiz
•
4th Grade
22 questions
fractions
Quiz
•
3rd Grade
20 questions
Main Idea and Details
Quiz
•
5th Grade
20 questions
Context Clues
Quiz
•
6th Grade
15 questions
Equivalent Fractions
Quiz
•
4th Grade
Discover more resources for Mathematics
20 questions
Graphing Inequalities on a Number Line
Quiz
•
6th - 9th Grade
18 questions
SAT Prep: Ratios, Proportions, & Percents
Quiz
•
9th - 10th Grade
12 questions
Exponential Growth and Decay
Quiz
•
9th Grade
12 questions
Parallel Lines Cut by a Transversal
Quiz
•
10th Grade
12 questions
Add and Subtract Polynomials
Quiz
•
9th - 12th Grade
15 questions
Combine Like Terms and Distributive Property
Quiz
•
8th - 9th Grade
20 questions
Function or Not a Function
Quiz
•
8th - 9th Grade
10 questions
Elijah McCoy: Innovations and Impact in Black History
Interactive video
•
6th - 10th Grade