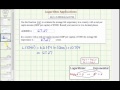
Understanding the Preston Curve
Interactive Video
•
Mathematics, Science
•
9th - 12th Grade
•
Practice Problem
•
Hard

Aiden Montgomery
FREE Resource
Read more
10 questions
Show all answers
1.
MULTIPLE CHOICE QUESTION
30 sec • 1 pt
What does the Preston Curve illustrate?
The relationship between GDP per capita and inflation rates.
The relationship between life expectancy and population density.
The relationship between life expectancy and real per capita income.
The relationship between population growth and GDP per capita.
2.
MULTIPLE CHOICE QUESTION
30 sec • 1 pt
Which mathematical function is used to model the Preston Curve?
Logarithmic function
Exponential function
Linear function
Quadratic function
3.
MULTIPLE CHOICE QUESTION
30 sec • 1 pt
How does life expectancy change as GDP per capita increases according to the Preston Curve?
Life expectancy decreases.
Life expectancy fluctuates randomly.
Life expectancy remains constant.
Life expectancy increases.
4.
MULTIPLE CHOICE QUESTION
30 sec • 1 pt
At what range of GDP per capita is the increase in life expectancy the greatest?
Above 30,000
Between 20,000 and 30,000
Between 10,000 and 20,000
Between 0 and 10,000
5.
MULTIPLE CHOICE QUESTION
30 sec • 1 pt
What is the estimated life expectancy for a country with a GDP per capita of $5,000?
67.27 years
72.45 years
45.67 years
50.89 years
6.
MULTIPLE CHOICE QUESTION
30 sec • 1 pt
Which of the following steps is NOT involved in calculating life expectancy using the Preston Curve formula?
Substituting GDP per capita into the formula
Multiplying GDP per capita by a constant
Using a calculator to find the natural log
Rounding the result to two decimal places
7.
MULTIPLE CHOICE QUESTION
30 sec • 1 pt
What is the first step in solving for GDP per capita given a life expectancy?
Subtracting a constant from both sides of the equation
Adding a constant to both sides of the equation
Dividing both sides by a constant
Multiplying both sides by a constant
Access all questions and much more by creating a free account
Create resources
Host any resource
Get auto-graded reports
Continue with Google

Continue with Email
Continue with Classlink
Continue with Clever
or continue with
Microsoft
%20(1).png)
Apple
Others
Already have an account?
Popular Resources on Wayground

15 questions
Fractions on a Number Line
Quiz
•
3rd Grade
20 questions
Equivalent Fractions
Quiz
•
3rd Grade
25 questions
Multiplication Facts
Quiz
•
5th Grade
29 questions
Alg. 1 Section 5.1 Coordinate Plane
Quiz
•
9th Grade
22 questions
fractions
Quiz
•
3rd Grade
11 questions
FOREST Effective communication
Lesson
•
KG
20 questions
Main Idea and Details
Quiz
•
5th Grade
20 questions
Context Clues
Quiz
•
6th Grade
Discover more resources for Mathematics
29 questions
Alg. 1 Section 5.1 Coordinate Plane
Quiz
•
9th Grade
20 questions
Graphing Inequalities on a Number Line
Quiz
•
6th - 9th Grade
20 questions
Box and Whisker Plots
Quiz
•
9th Grade
18 questions
Exponential Growth and Decay
Quiz
•
9th Grade
20 questions
Function or Not a Function
Quiz
•
8th - 9th Grade
20 questions
SSS/SAS
Quiz
•
9th - 12th Grade
14 questions
Making Inferences From Samples
Quiz
•
7th - 12th Grade
23 questions
CCG - CH8 Polygon angles and area Review
Quiz
•
9th - 12th Grade