
Analyzing Data with Tally Charts

Interactive Video
•
Mathematics, Education
•
3rd - 5th Grade
•
Practice Problem
•
Hard

Olivia Brooks
FREE Resource
Read more
10 questions
Show all answers
1.
MULTIPLE CHOICE QUESTION
30 sec • 1 pt
What is the sum of 7 and 9?
15
18
16
17
2.
MULTIPLE CHOICE QUESTION
30 sec • 1 pt
How does a scaled bar graph differ from a regular bar graph?
It uses colors to represent data.
It is always vertical.
It uses a scale to measure intervals.
It has no labels.
3.
MULTIPLE CHOICE QUESTION
30 sec • 1 pt
In the example, how many students chose pizza as their favorite food?
6
5
7
8
4.
MULTIPLE CHOICE QUESTION
30 sec • 1 pt
What is the purpose of a tally chart?
To calculate averages.
To collect and organize data.
To display data visually.
To compare two sets of data.
5.
MULTIPLE CHOICE QUESTION
30 sec • 1 pt
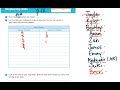
How many students could do zero pull-ups according to the tally chart?
4
7
5
6
6.
MULTIPLE CHOICE QUESTION
30 sec • 1 pt
What is the first step in creating a bar graph from a tally chart?
Choose colors for the bars.
Count the tally marks.
Label the axes.
Draw the bars.
7.
MULTIPLE CHOICE QUESTION
30 sec • 1 pt
How many letters are in the name 'Jayla'?
4
6
3
5
Access all questions and much more by creating a free account
Create resources
Host any resource
Get auto-graded reports

Continue with Google

Continue with Email

Continue with Microsoft
or continue with

%20(1).png)
Apple

Others
By signing up, you agree to our Terms of Service & Privacy Policy
Already have an account?


